Fig. 6.
Download original image
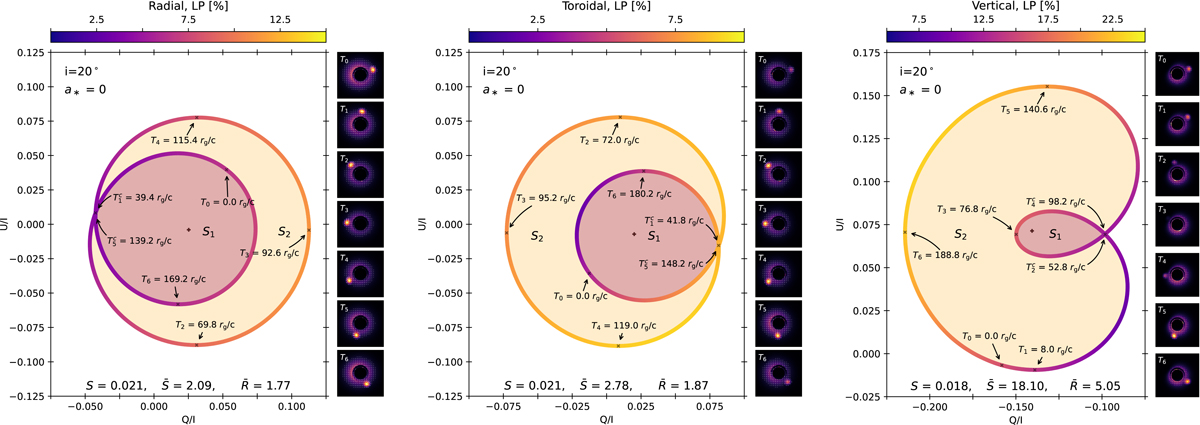
Schematic diagrams of normalized 𝒬 − 𝒰 loops of the full models (for i = 20°, a* = 0) with the radial, toroidal, and vertical magnetic field configurations in the left, middle, and right panels, respectively. The loop color encodes the model LP. The inner loop surface S1 (in pink) and rest of surface (excluding S1) enclosed by the entire 𝒬 − 𝒰 loop structure is denoted by S2 (in yellow). The total surface is S = S1 + S2, surface fraction is ![]() , and time spent in the inner loop with respect to the total period is
, and time spent in the inner loop with respect to the total period is ![]() (similar to Wielgus et al. 2022b). The “+” symbol marks the normalized 𝒬 − 𝒰 value of the static background emission. All shown loops are traversed in the counterclockwise direction.
(similar to Wielgus et al. 2022b). The “+” symbol marks the normalized 𝒬 − 𝒰 value of the static background emission. All shown loops are traversed in the counterclockwise direction.
Current usage metrics show cumulative count of Article Views (full-text article views including HTML views, PDF and ePub downloads, according to the available data) and Abstracts Views on Vision4Press platform.
Data correspond to usage on the plateform after 2015. The current usage metrics is available 48-96 hours after online publication and is updated daily on week days.
Initial download of the metrics may take a while.