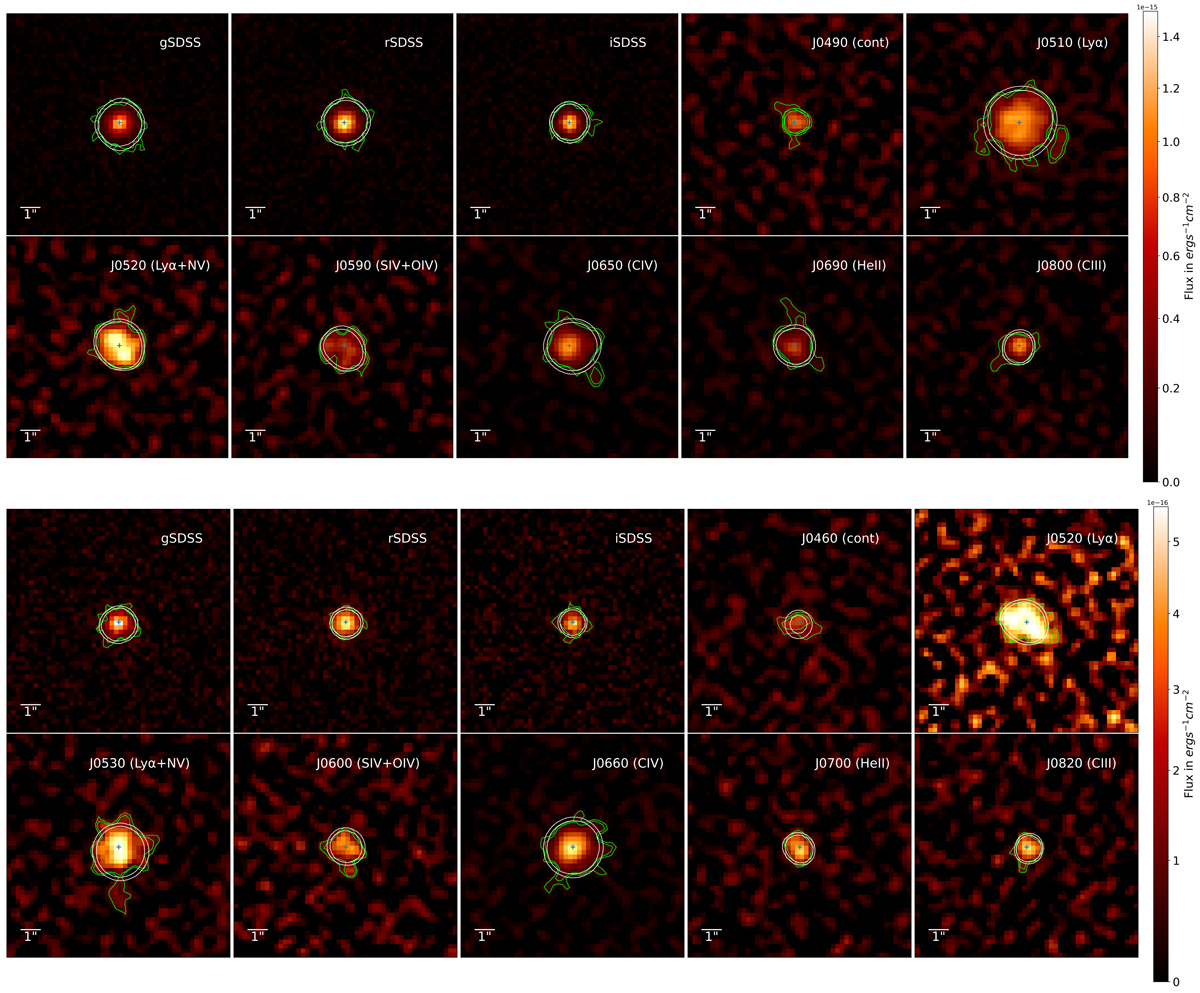
Fig. 4.
Download original image
MiniJPAS BB images and NB images of QSO1 (upper panel) and QSO2 (lower panel) covering the most prominent emission lines. The cross is the center of the QSO. All images are 11.3″ × 11.3″ size. The green (NB image) and white (PSF) contour levels represent the isophote of 2σ and 3σ above the background STD of the NB image. The center of the double-core coincides with the center of QSOs in BB filters.
Current usage metrics show cumulative count of Article Views (full-text article views including HTML views, PDF and ePub downloads, according to the available data) and Abstracts Views on Vision4Press platform.
Data correspond to usage on the plateform after 2015. The current usage metrics is available 48-96 hours after online publication and is updated daily on week days.
Initial download of the metrics may take a while.