Open Access
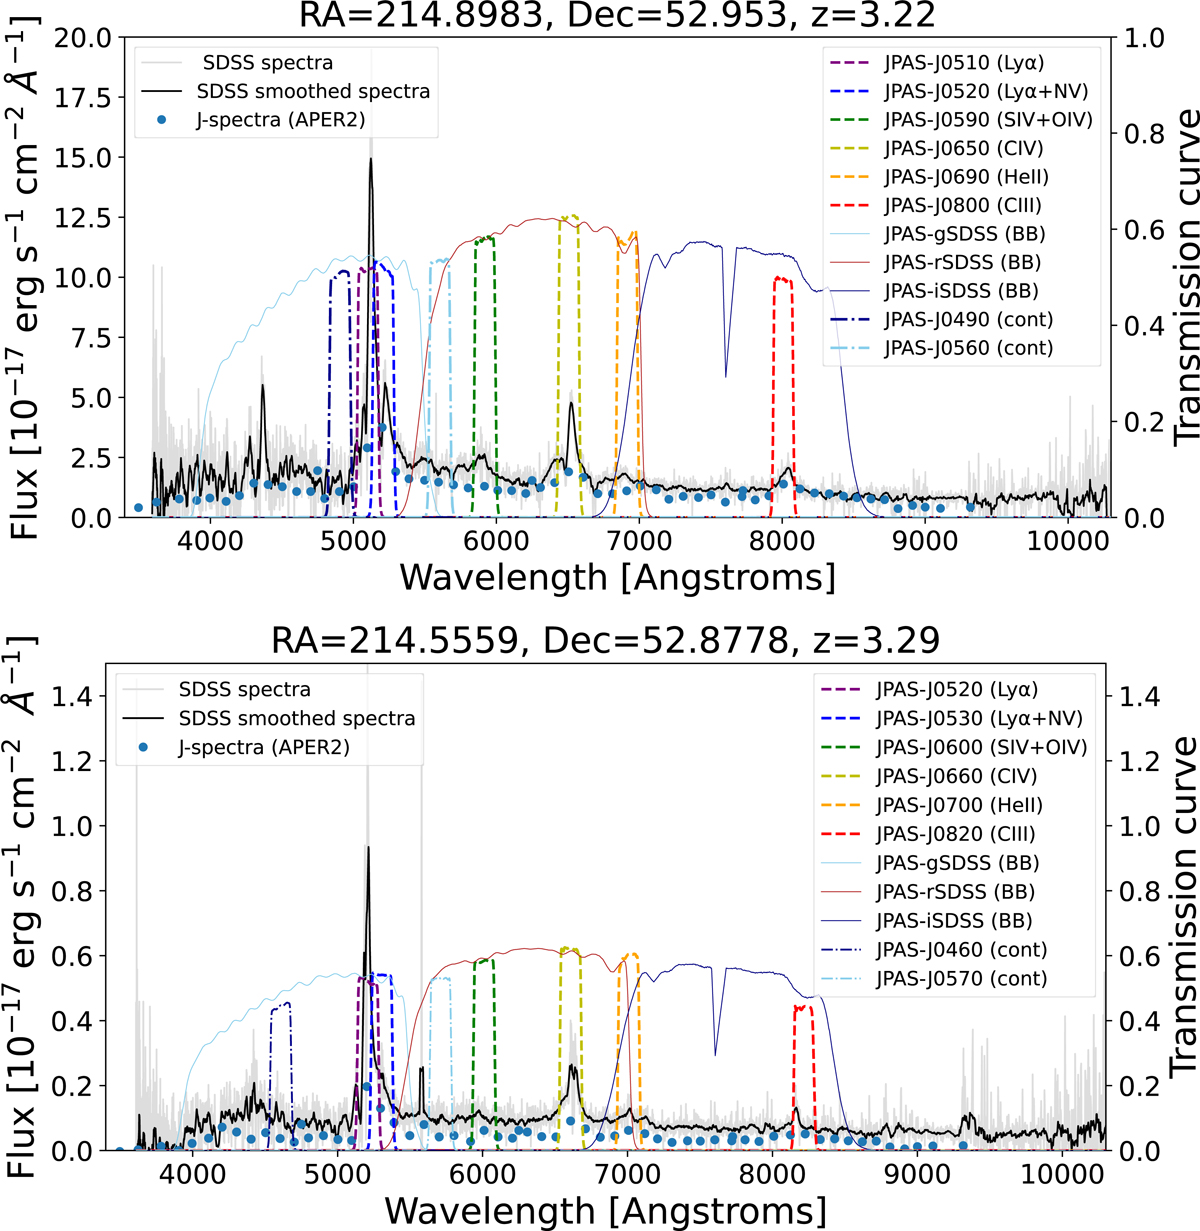
Fig. 3.
Download original image
SDSS spectra (grey), Smoothed SDSS spectra (black) and J-spectra (blue dots) overplotted with different NB and BB J-PAS filter curves covering the most prominent emission lines and the continuum (used to measure continuum flux of Lyα covering NB images).
Current usage metrics show cumulative count of Article Views (full-text article views including HTML views, PDF and ePub downloads, according to the available data) and Abstracts Views on Vision4Press platform.
Data correspond to usage on the plateform after 2015. The current usage metrics is available 48-96 hours after online publication and is updated daily on week days.
Initial download of the metrics may take a while.