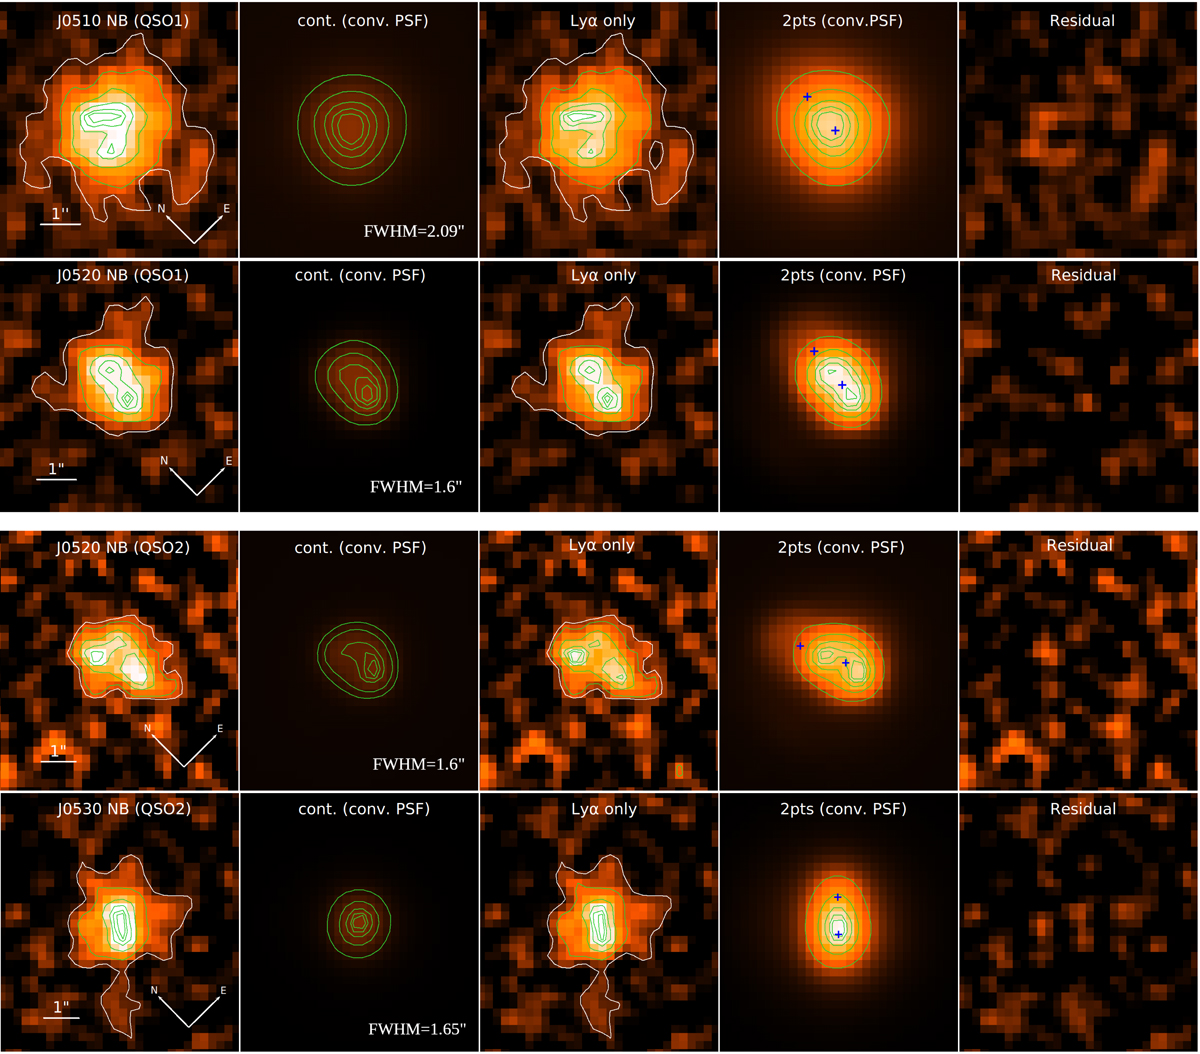
Fig. 1.
Download original image
QSO1 and QSO2 in two Lyα NB J-PAS filters. First column shows NB miniJPAS image; second shows continuum image created by convolving PSF of Lyα image with continuum flux; third column is the continuum subtracted Lyα image; fourth column is the PSFs in two points convolved with Lyα flux; and fifth column shows the residual after subtracting two pts PSF from Lyα image. Blue crosses represent the center of the PSF position given for GALFIT fitting, and the white contour in the 1st and 3rd column represents an isophote of 2σ above the background STD. Green contours represent 30%, 60%, 80%, 90%, and 95% of the peak values in the corresponding images. The FWHM size of the PSFs is indicated in the second column.
Current usage metrics show cumulative count of Article Views (full-text article views including HTML views, PDF and ePub downloads, according to the available data) and Abstracts Views on Vision4Press platform.
Data correspond to usage on the plateform after 2015. The current usage metrics is available 48-96 hours after online publication and is updated daily on week days.
Initial download of the metrics may take a while.