Fig. 8.
Download original image
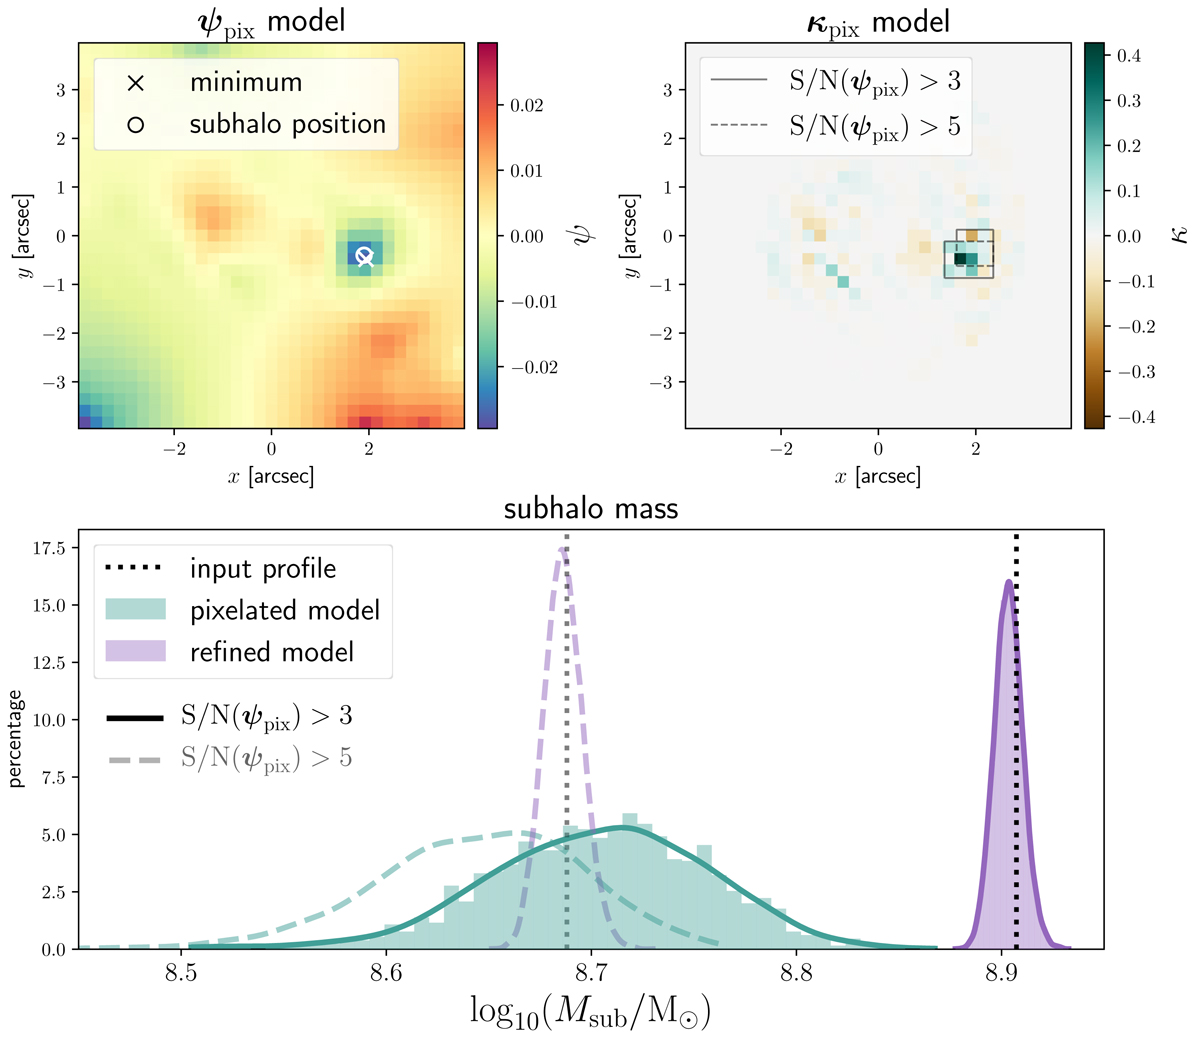
Characterization of the position and mass of the localized subhalo based on our model of lens LS. Top left: ψpix model, from which we assign the detected subhalo position to the minimum of the clear negative feature, in good agreement with the input subhalo position. Top right: pixelated convergence model κpix obtained from the ψpix model. We indicate the fiducial pixelated region within which we compute the subhalo mass, defined as the pixels with S/N(ψpix) > 3 (see also the bottom panel of Fig. 5). A smaller region corresponding to S/N(ψpix) > 5 is also shown, in dashed lines. Bottom: posterior distributions of the subhalo mass, as estimated from the pixelated model, and from the refined model that replaces ψpix with a SIS profile for the subhalo. The two pairs of posterior distributions corresponding to each pixelated region are shown in continuous (S/N(ψpix) > 3) or dashed lines (S/N(ψpix) > 5). For each pixelated region, the black dotted line indicates the mass computed from the input convergence profile of the subhalo.
Current usage metrics show cumulative count of Article Views (full-text article views including HTML views, PDF and ePub downloads, according to the available data) and Abstracts Views on Vision4Press platform.
Data correspond to usage on the plateform after 2015. The current usage metrics is available 48-96 hours after online publication and is updated daily on week days.
Initial download of the metrics may take a while.