Fig. 5.
Download original image
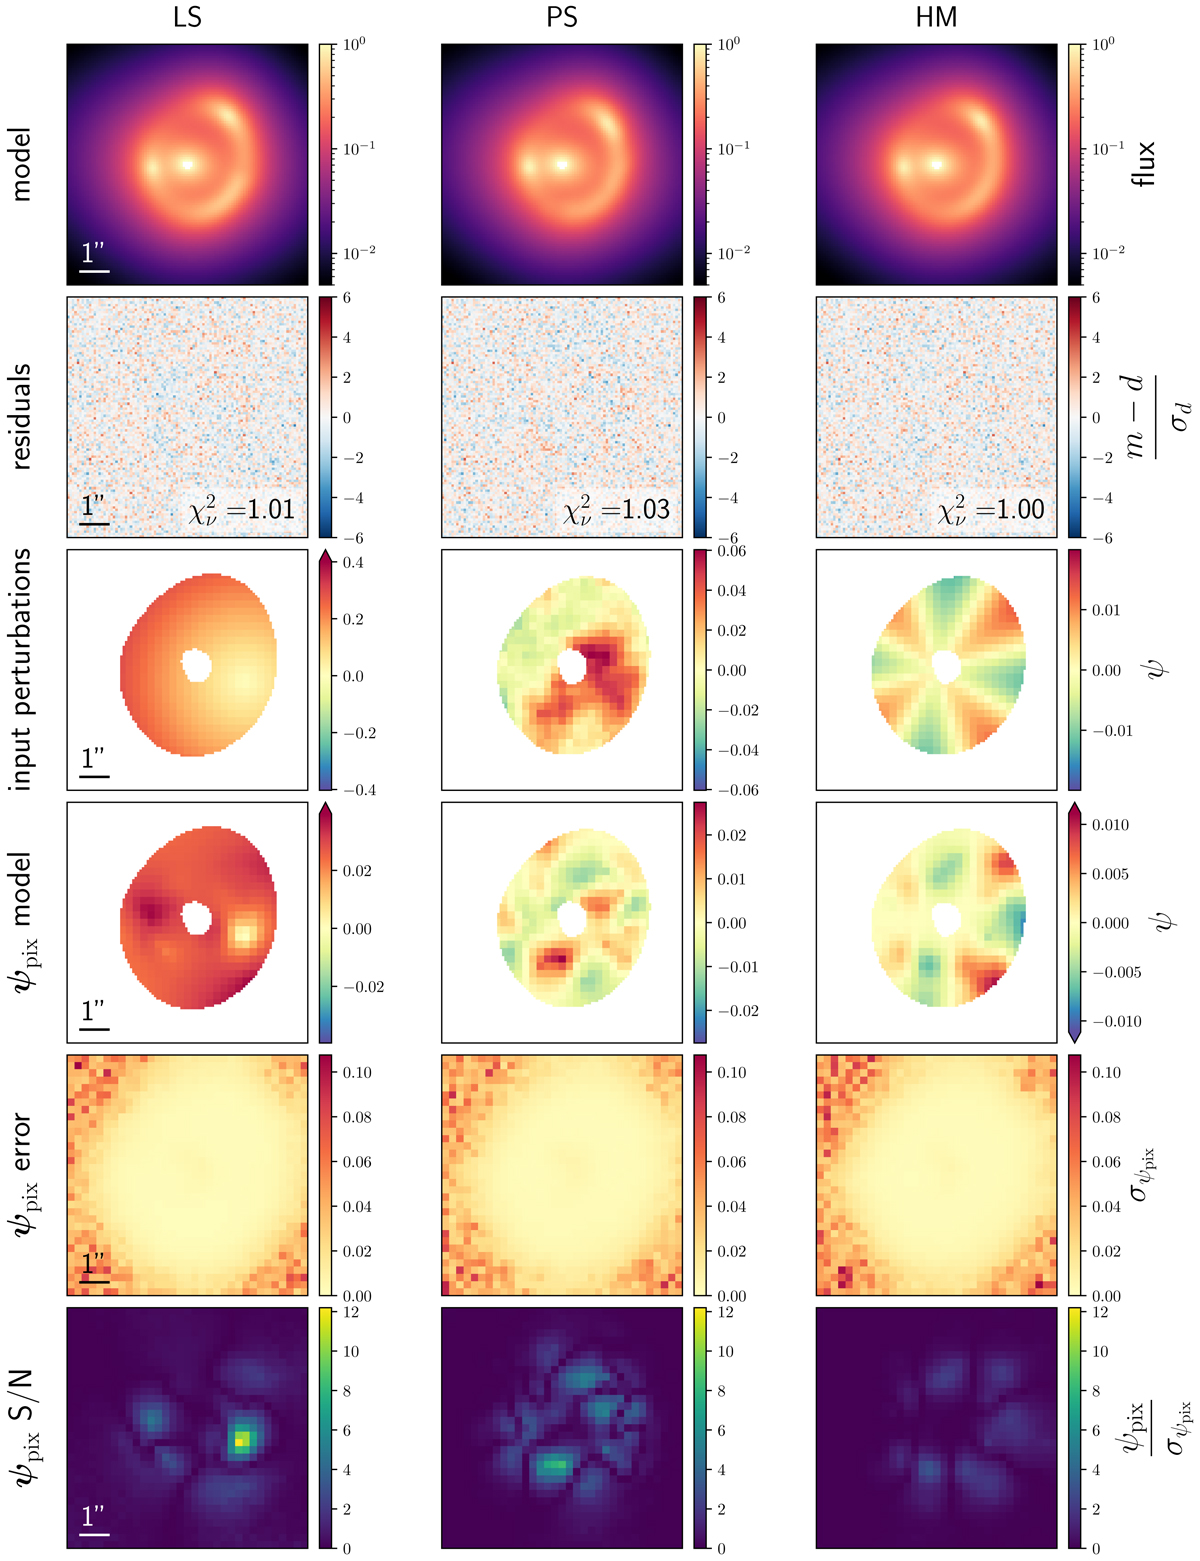
Best-fit models on the simulated data set, after full modeling of the lens potential and the source. The first four rows are as in Fig. 4. The last two rows show, in order: the standard deviation for each ψpix pixel obtained from HMC sampling of the posterior, and the S/N maps that correspond to the absolute value of the modeled potential divided by the standard deviation.
Current usage metrics show cumulative count of Article Views (full-text article views including HTML views, PDF and ePub downloads, according to the available data) and Abstracts Views on Vision4Press platform.
Data correspond to usage on the plateform after 2015. The current usage metrics is available 48-96 hours after online publication and is updated daily on week days.
Initial download of the metrics may take a while.