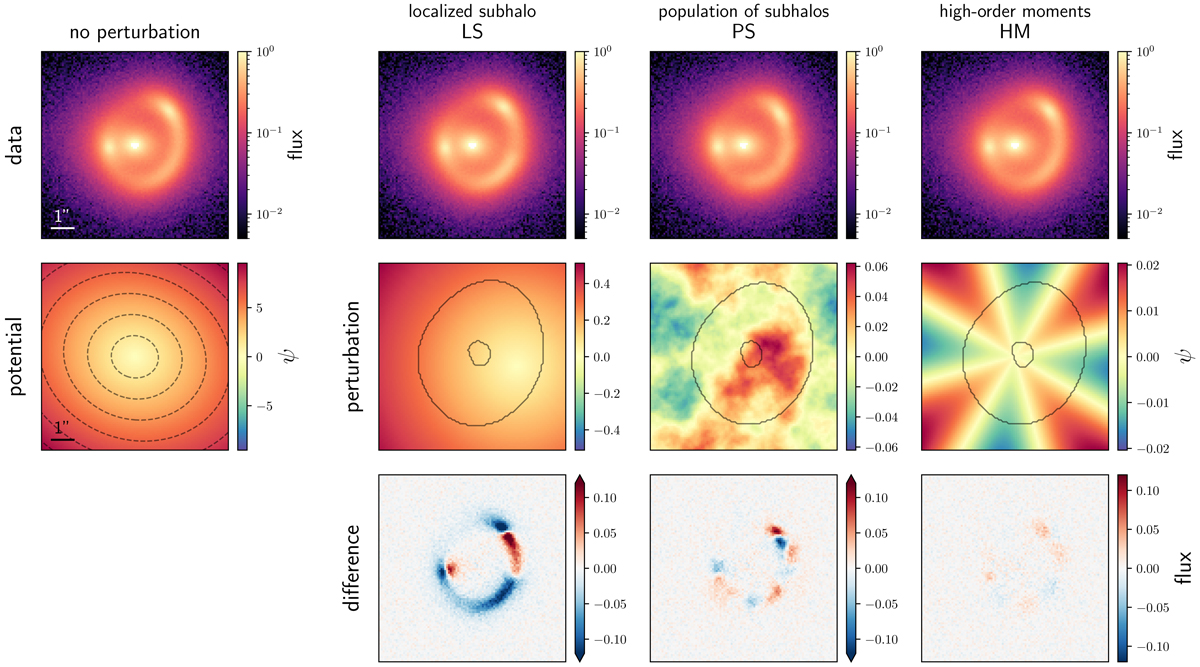
Fig. 3.
Download original image
Overview of the simulated HST observations. The left-most column shows the simulated data without perturbations to the smooth lens potential. The dashed lines in the bottom-left panel are isopotential contours. The remaining columns show the mock data used in this work (top row), the three different input potential perturbations (middle row), and the difference between the unperturbed and perturbed lenses (bottom row). The range (min and max) of the perturbations varies according to the different nature of the perturbers. The solid lines enclose the region where the S/N of the lensed source is higher than 5. The isopotential contours are almost indistinguishable between the unperturbed and perturbed cases, therefore we omit them.
Current usage metrics show cumulative count of Article Views (full-text article views including HTML views, PDF and ePub downloads, according to the available data) and Abstracts Views on Vision4Press platform.
Data correspond to usage on the plateform after 2015. The current usage metrics is available 48-96 hours after online publication and is updated daily on week days.
Initial download of the metrics may take a while.