Fig. 18
Download original image
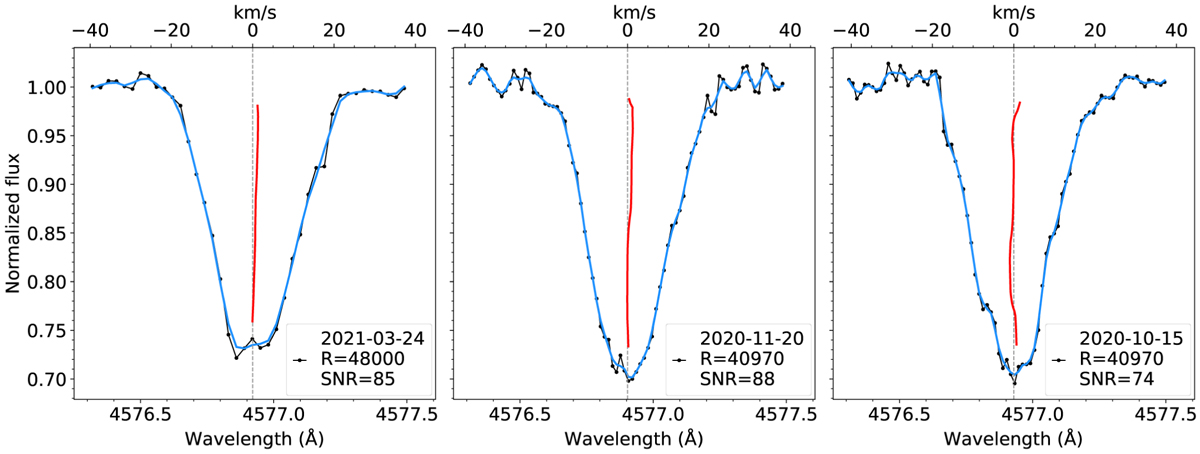
FeIIλ4576.3 absorption line of TIC 167124706 at three different epochs. The bisector of the line is shown in red and is calculated with respect to the smoothed spectrum shown in blue. The smoothed spectrum is generated by a moving average using the window length of three data points. The top axis shows the Doppler velocity with respect to the central wavelength of the absorption line indicated with the vertical dashed line. The spectrum is not corrected by redshift. Observation dates, spectral resolutions, and signal-to-noise ratios are listed in the insets.
Current usage metrics show cumulative count of Article Views (full-text article views including HTML views, PDF and ePub downloads, according to the available data) and Abstracts Views on Vision4Press platform.
Data correspond to usage on the plateform after 2015. The current usage metrics is available 48-96 hours after online publication and is updated daily on week days.
Initial download of the metrics may take a while.