Fig. 11
Download original image
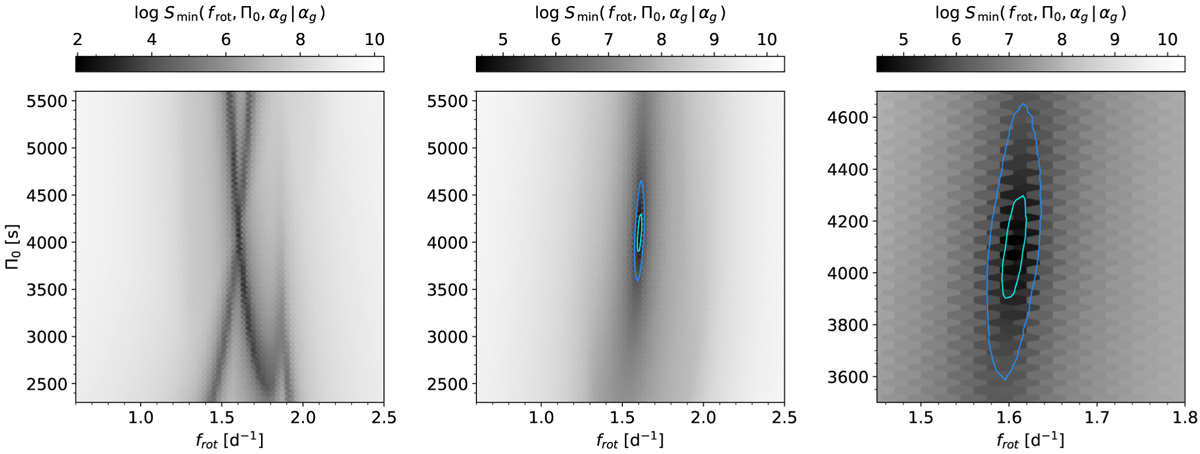
Improvement of the determination of frot and ∏0 for TIC 381950897 when fitting its two detected period-spacing patterns simultaneously. It concerns a prograde mode (0,1) and a retrograde mode (−2, −1) pattern. The left panel shows an overplot of the two cost functions in which the valley of S with an overall d∏0/dfrot > 0 corresponds to the prograde mode, while the other valley refers to the retrograde mode. Contour lines are omitted for better visibility but were shown in Fig. 5, where both cost functions were shown separately. The middle panel shows the cost function when both patterns are fitted simultaneously. The solution lies at the intersection of the two valleys from the left panel. The right panel shows a close-up of the middle panel. The blue contour line indicates S = 100 Smin, while the cyan one indicates S = 10 Smin.
Current usage metrics show cumulative count of Article Views (full-text article views including HTML views, PDF and ePub downloads, according to the available data) and Abstracts Views on Vision4Press platform.
Data correspond to usage on the plateform after 2015. The current usage metrics is available 48-96 hours after online publication and is updated daily on week days.
Initial download of the metrics may take a while.