Fig. 14.
Download original image
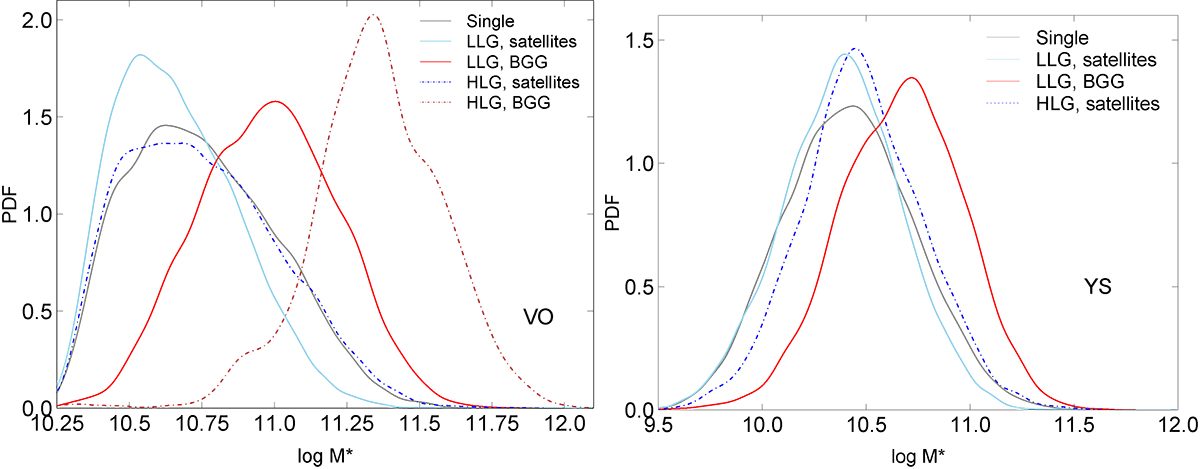
Distributions of stellar mass M⋆ for single galaxies (grey lines), satellites galaxies in LLGs and HLGs (light and dark blue lines, respectively), and BGGs of LLGs and HLGs (light red and dark red lines, respectively) for VO galaxies (left panel) and YS galaxies (right panel) in global luminosity–density regions D8 > 1. Solid lines show single galaxies and LLG members, and dot-dashed lines show HLG members.
Current usage metrics show cumulative count of Article Views (full-text article views including HTML views, PDF and ePub downloads, according to the available data) and Abstracts Views on Vision4Press platform.
Data correspond to usage on the plateform after 2015. The current usage metrics is available 48-96 hours after online publication and is updated daily on week days.
Initial download of the metrics may take a while.