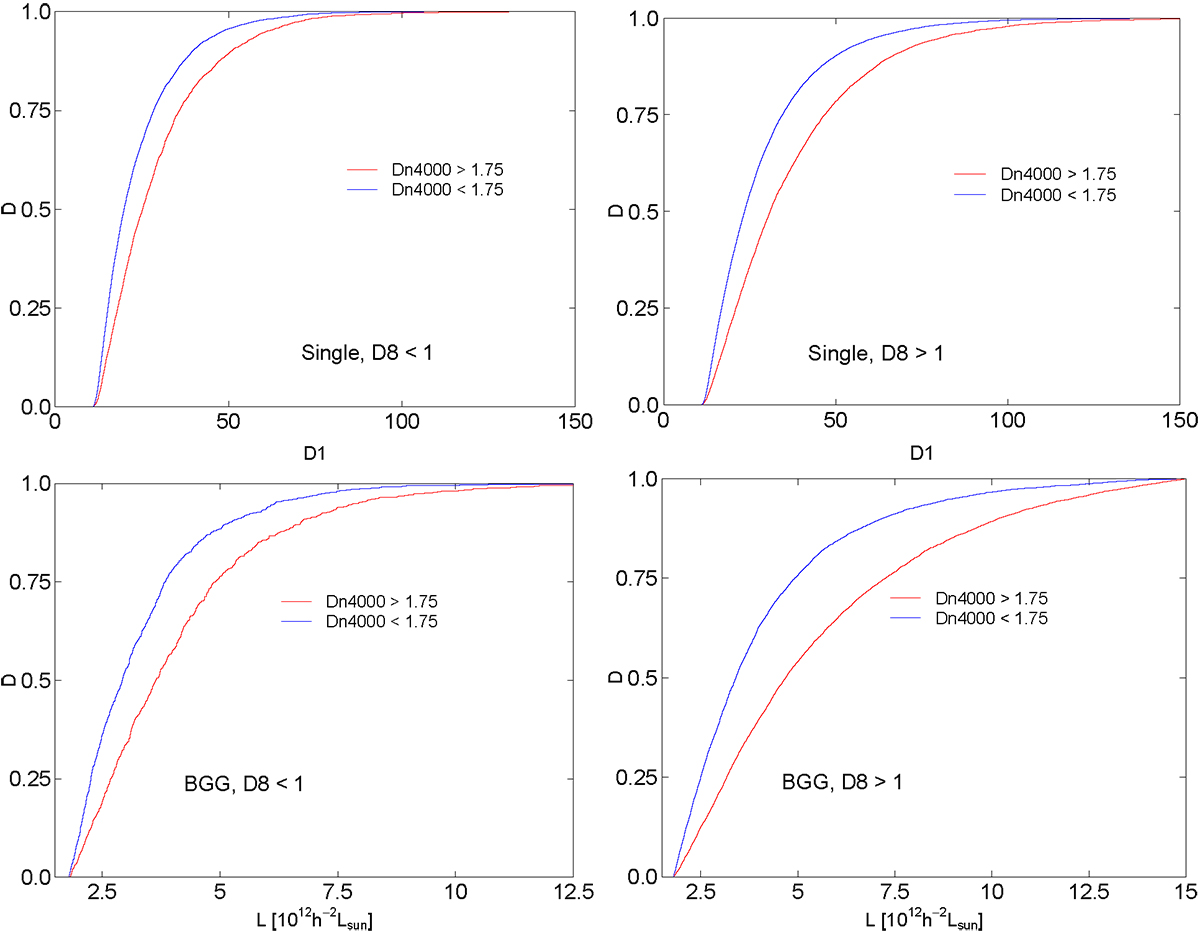
Fig. 13.
Download original image
Distributions of local luminosity densities D1 for single galaxies (upper row) and group luminosities Lgr for BGGs of LLGs (lower row) in global low-luminosity regions (D8 ≤ 1, left panels) and global high-luminosity regions (D8 > 1, right panels). Red lines: Single galaxies and BGGs with Dn(4000) > 1.75 (VO galaxies). Blue lines: Dn(4000) < 1.75 (YS galaxies).
Current usage metrics show cumulative count of Article Views (full-text article views including HTML views, PDF and ePub downloads, according to the available data) and Abstracts Views on Vision4Press platform.
Data correspond to usage on the plateform after 2015. The current usage metrics is available 48-96 hours after online publication and is updated daily on week days.
Initial download of the metrics may take a while.