Fig. 1.
Download original image
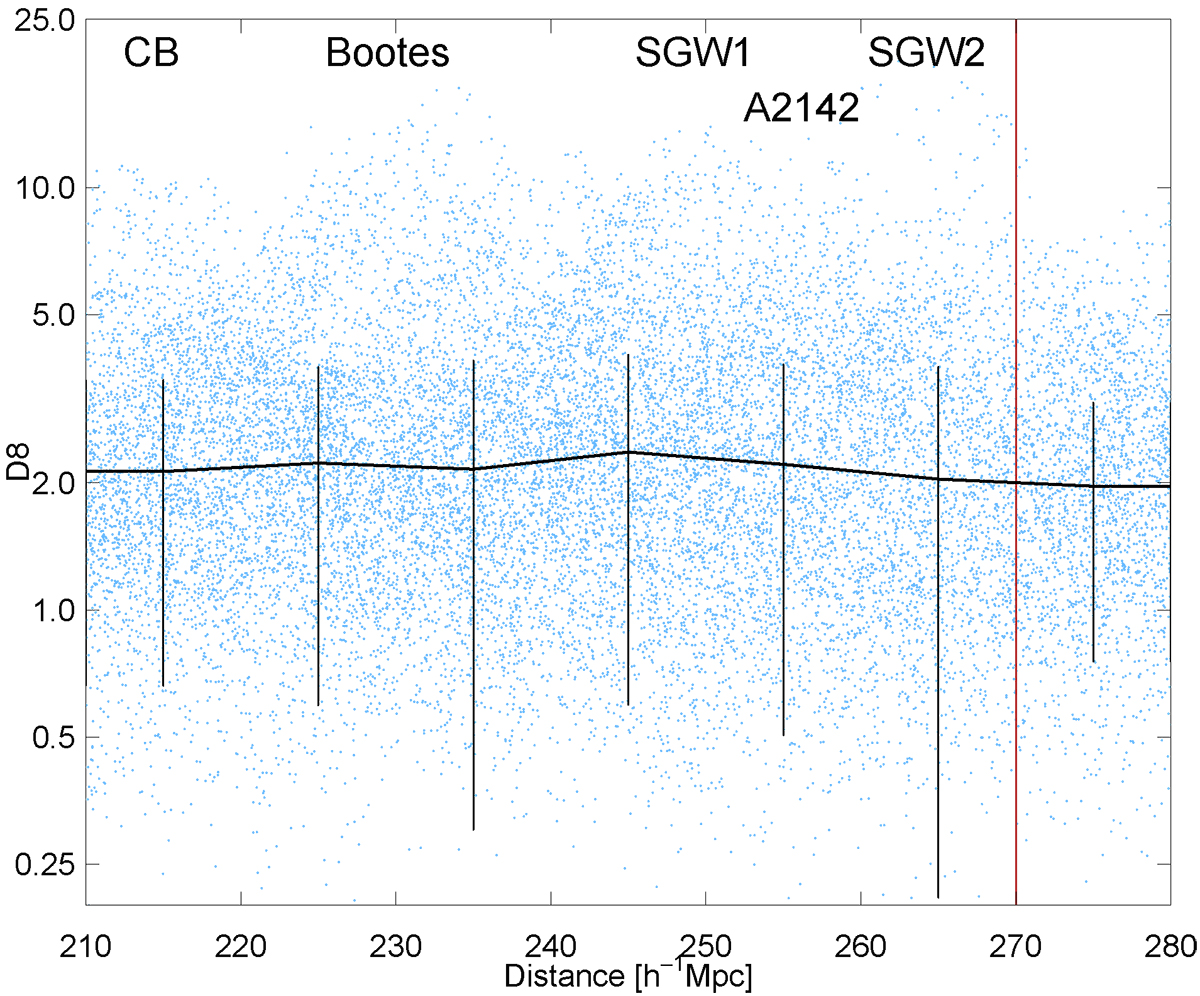
Distribution of global luminosity density D8 around galaxies versus distance. The black line with error bars shows the median value of global luminosity density D8 at a given distance. We note that the logarithmic scale enhances low values of density and the associated errors. We mark several rich superclusters where D8 values are high. CB denotes the Corona Borealis supercluster, A2142 marks the supercluster SCL A2142, and SGW1 and SGW2 mark the locations of the two richest superclusters in the Sloan Great Wall. The dark red line shows the distance limit 270 h−1 Mpc used to define our final sample of galaxies.
Current usage metrics show cumulative count of Article Views (full-text article views including HTML views, PDF and ePub downloads, according to the available data) and Abstracts Views on Vision4Press platform.
Data correspond to usage on the plateform after 2015. The current usage metrics is available 48-96 hours after online publication and is updated daily on week days.
Initial download of the metrics may take a while.