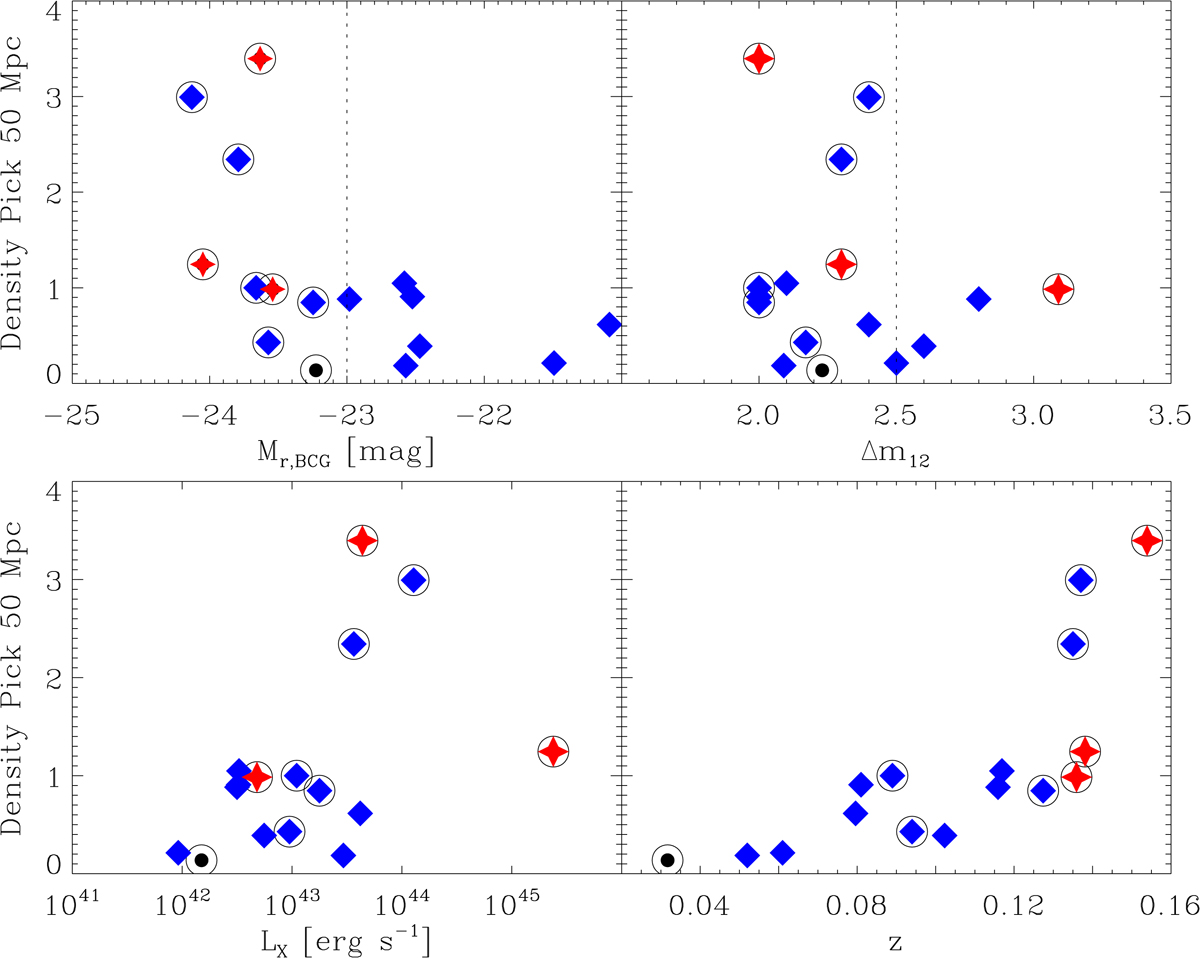
Fig. 6.
Download original image
Correlations between the absolute magnitude of the BCG (top left panel), the magnitude gap (top right panel), the X-ray luminosity (bottom left panel), and redshift (bottom right) vs. the density of galaxies brighter than −22 within 50 Mpc. The area is computed using Pick’s theorem, so footprint incompleteness is properly taken into account. Colour coding and symbols are the same as in Fig. 2. Big open circles represent FGs with central galaxies brighter than −22.
Current usage metrics show cumulative count of Article Views (full-text article views including HTML views, PDF and ePub downloads, according to the available data) and Abstracts Views on Vision4Press platform.
Data correspond to usage on the plateform after 2015. The current usage metrics is available 48-96 hours after online publication and is updated daily on week days.
Initial download of the metrics may take a while.