Fig. 4.
Download original image
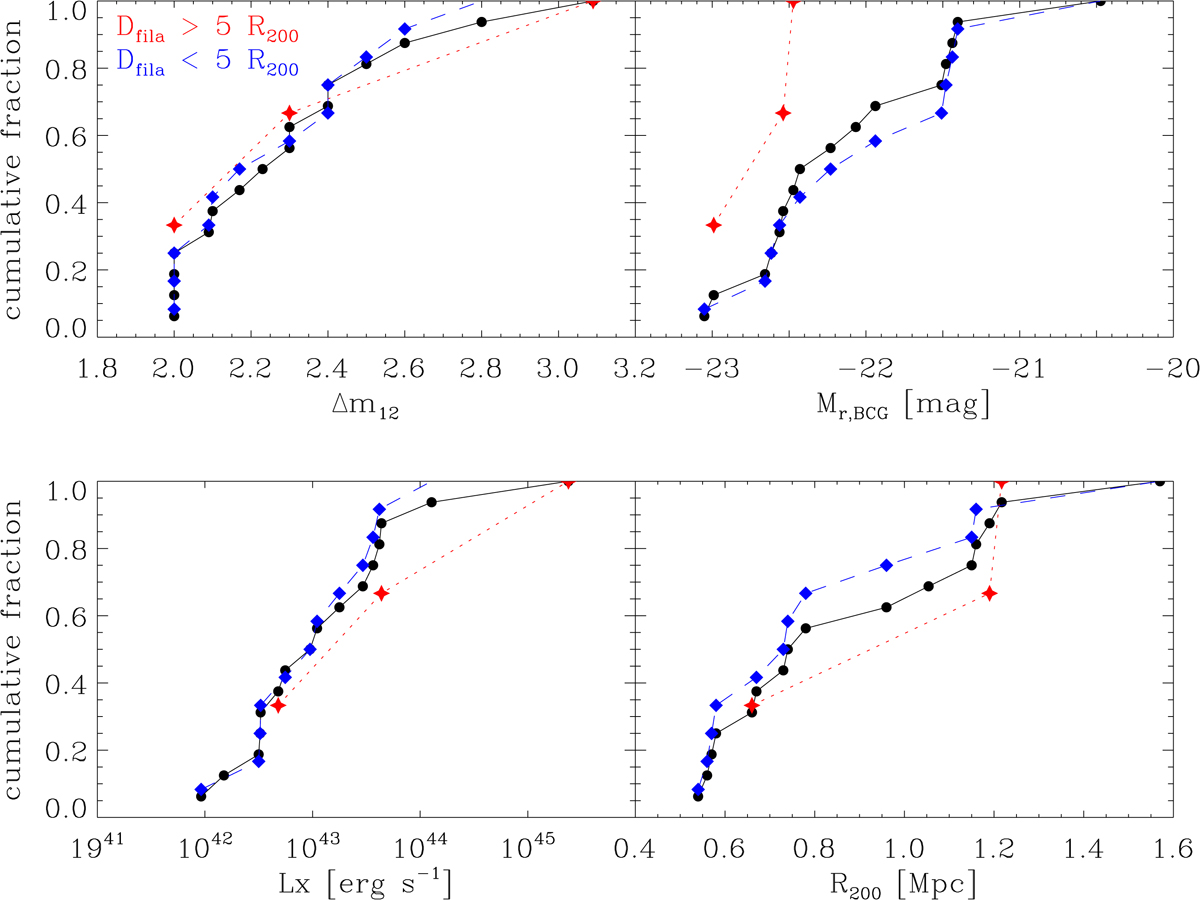
Cumulative distribution of Δm12 (top left panel), absolute magnitude of the BCG (top right panel), X-ray luminosity (bottom left panel), and R200 (bottom right panel). In each panel, the full FG population is described with the solid black line and black circles, FGs close to filaments are represented with blue dashed line and diamonds, and FGs far from filaments are shown with red dashed-dotted line and stars.
Current usage metrics show cumulative count of Article Views (full-text article views including HTML views, PDF and ePub downloads, according to the available data) and Abstracts Views on Vision4Press platform.
Data correspond to usage on the plateform after 2015. The current usage metrics is available 48-96 hours after online publication and is updated daily on week days.
Initial download of the metrics may take a while.