Open Access
Fig. 3.
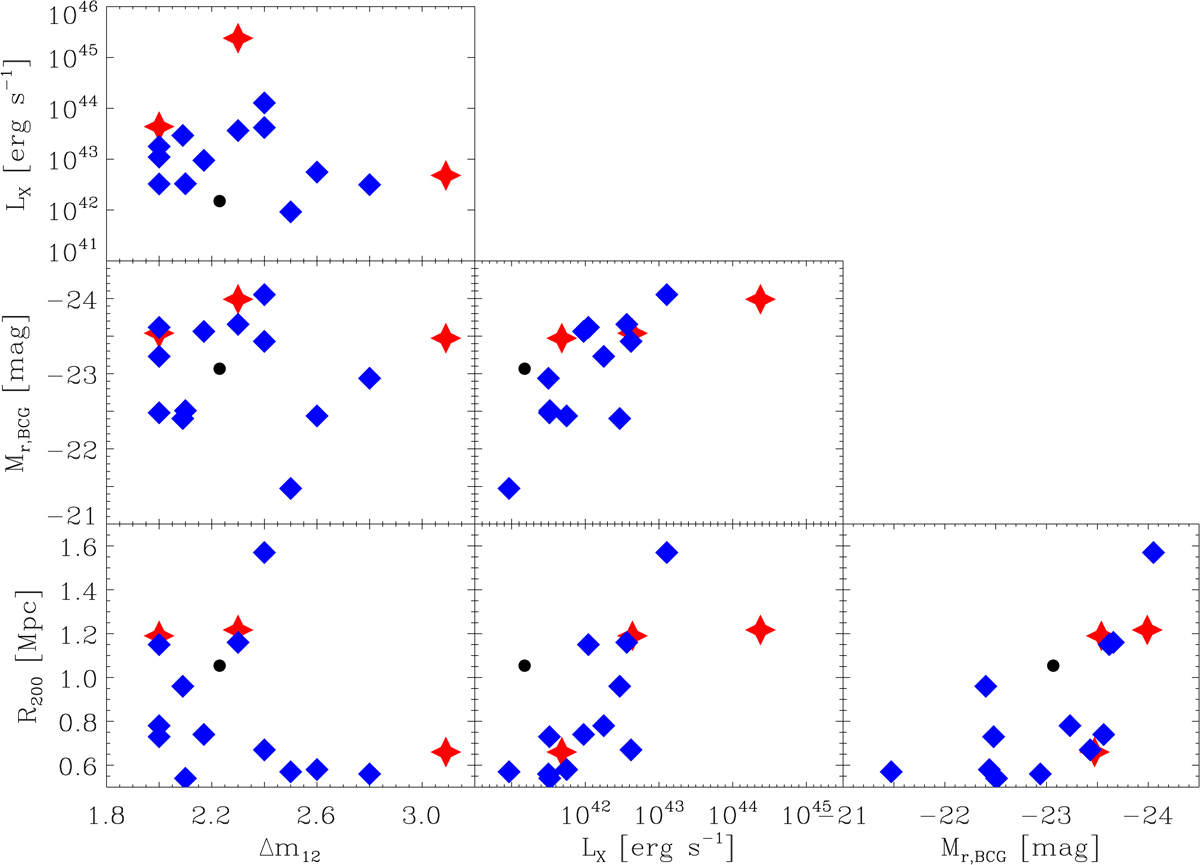
Download original image
Comparison between the main general properties of the clusters in our sample. Colour code is the same as in Fig. 2, but here we also show AWM4 as a black dot, since this FG is found at a redshift where the Chen et al. (2016) catalogue is not available and thus it cannot be classified based on its distance to a filament.
Current usage metrics show cumulative count of Article Views (full-text article views including HTML views, PDF and ePub downloads, according to the available data) and Abstracts Views on Vision4Press platform.
Data correspond to usage on the plateform after 2015. The current usage metrics is available 48-96 hours after online publication and is updated daily on week days.
Initial download of the metrics may take a while.