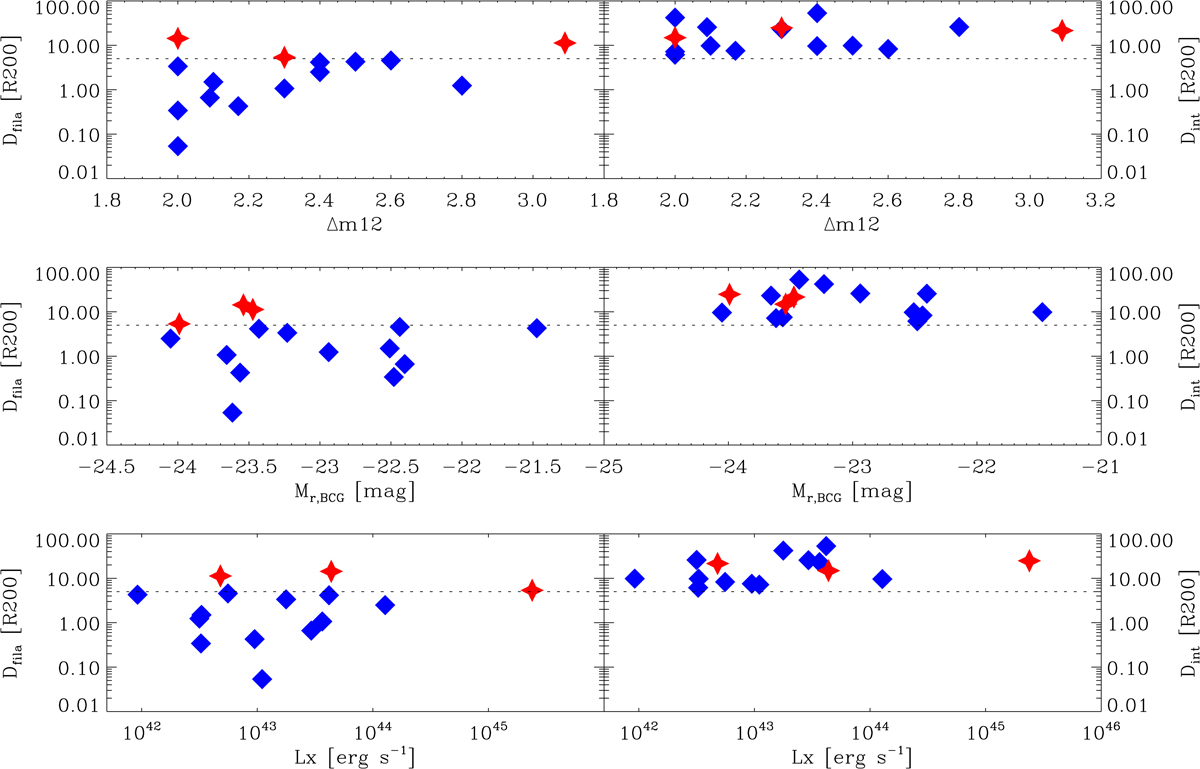
Fig. 2.
Download original image
Correlations between Δm12 (top panel), Mr, BCG (middle panel), and LX (lower panel) and the distance to the filament (left column) in units of R200. Same parameters correlated with the distance to the intersections (right column). The dashed horizontal line in the left panel represents 5 R200, which is the distance that we used to separate FGs that are close to filaments (Dfila < 5 R200, blue diamonds) from those that are not (red stars).
Current usage metrics show cumulative count of Article Views (full-text article views including HTML views, PDF and ePub downloads, according to the available data) and Abstracts Views on Vision4Press platform.
Data correspond to usage on the plateform after 2015. The current usage metrics is available 48-96 hours after online publication and is updated daily on week days.
Initial download of the metrics may take a while.