Fig. 9
Download original image
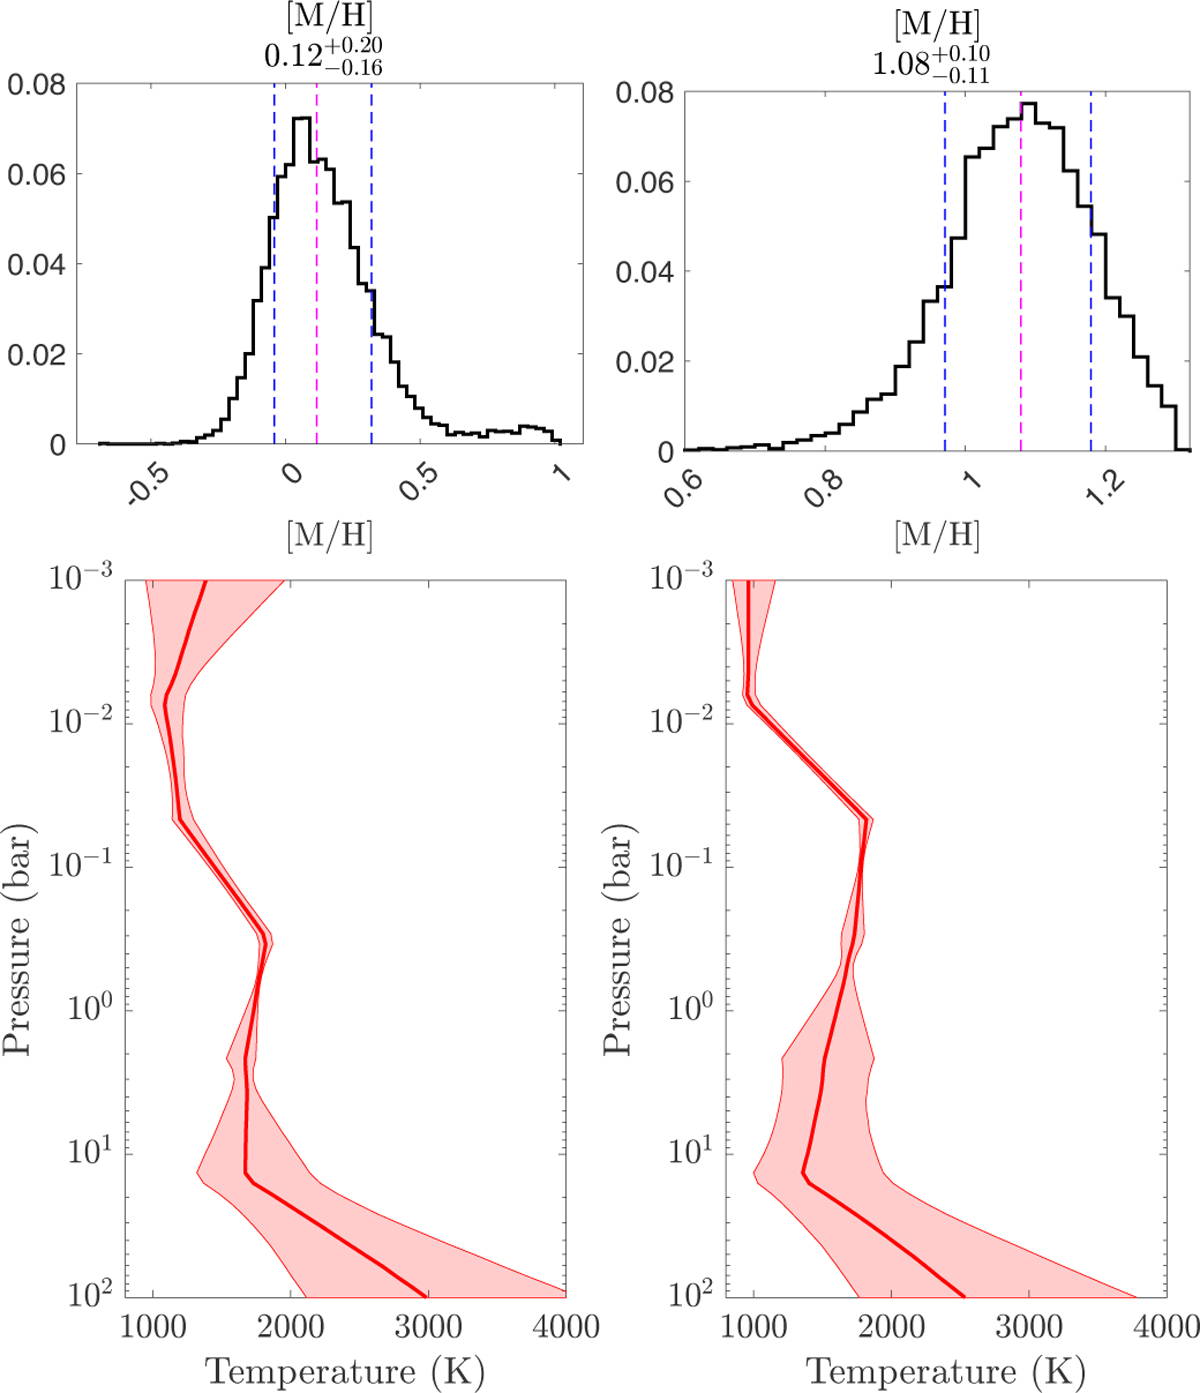
Posterior distributions for the secondary-eclipse retrieval of WASP-43b. The solar-metallicity and high-metallicity peaks described in the text are shown in the left and right column respectively. In each column, the upper panel shows the posterior for the metallicity [M/H], where the vertical, magenta line indicates the median of the distribution and the blue lines the corresponding 1-σ intervals. The lower panel depicts the retrieved temperature-pressure profile. The thick, red line is the median temperature profile, while the shaded red area is the 1-σ interval of the temperature distribution.
Current usage metrics show cumulative count of Article Views (full-text article views including HTML views, PDF and ePub downloads, according to the available data) and Abstracts Views on Vision4Press platform.
Data correspond to usage on the plateform after 2015. The current usage metrics is available 48-96 hours after online publication and is updated daily on week days.
Initial download of the metrics may take a while.