Fig. 4
Download original image
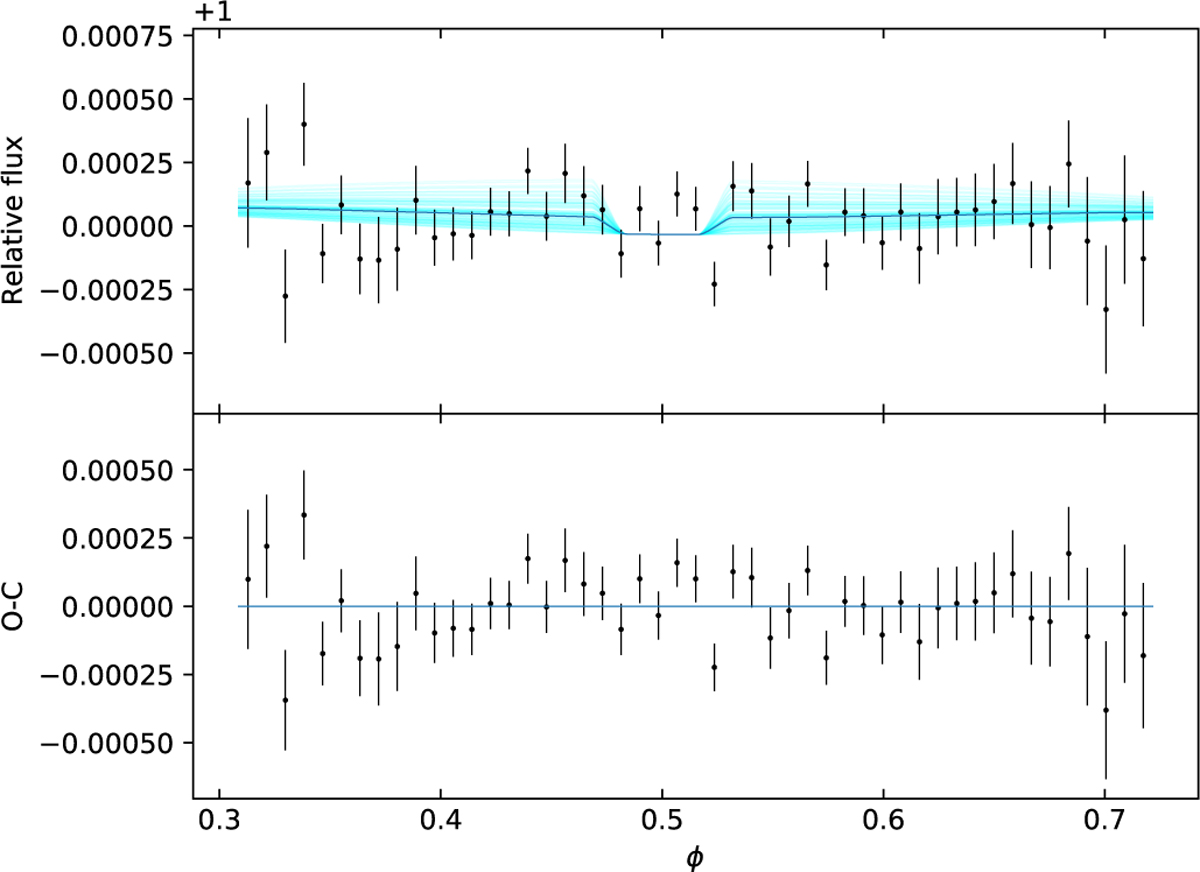
Phase-folded CHEOPS photometry of the secondary eclipses of WASP-43b, corrected for stellar and instrumental correlated noise. The solid line is the best-fit model. The corresponding residuals are shown in the bottom panel. For visualization purposes, in both panels the data are binned at regular steps. The shaded cyan lines in the top panel correspond to the model computed using 100 random steps in the MCMC chain.
Current usage metrics show cumulative count of Article Views (full-text article views including HTML views, PDF and ePub downloads, according to the available data) and Abstracts Views on Vision4Press platform.
Data correspond to usage on the plateform after 2015. The current usage metrics is available 48-96 hours after online publication and is updated daily on week days.
Initial download of the metrics may take a while.