Fig. 3
Download original image
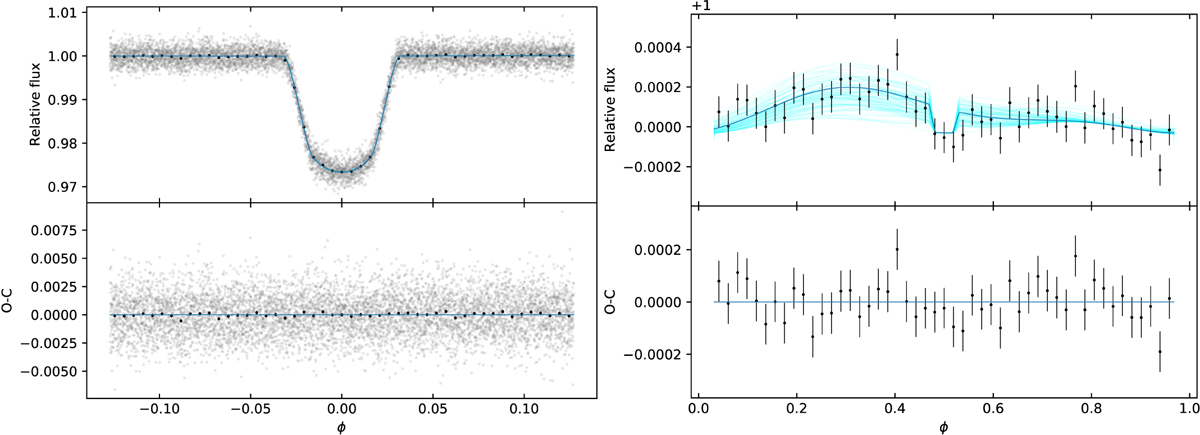
Result of the fit of the TESS LCs. Left: close-up of the phase-folded planetary transits observed with TESS, after the removal of the stellar activity (top panel). The solid blue line is the best fit model, while the black dots represent the rebinned photometry. The corresponding residuals are shown in the bottom panel. Right: same as in the left panel, but centered on the eclipse. For visualization purposes, the vertical axis has been zoomed in and only the rebinned photometry is shown. To give an idea of the uncertainty on the best fit model, the shaded cyan lines in the top panel correspond to the model computed using 100 random steps in the MCMC chain.
Current usage metrics show cumulative count of Article Views (full-text article views including HTML views, PDF and ePub downloads, according to the available data) and Abstracts Views on Vision4Press platform.
Data correspond to usage on the plateform after 2015. The current usage metrics is available 48-96 hours after online publication and is updated daily on week days.
Initial download of the metrics may take a while.