Fig. C.1
Download original image
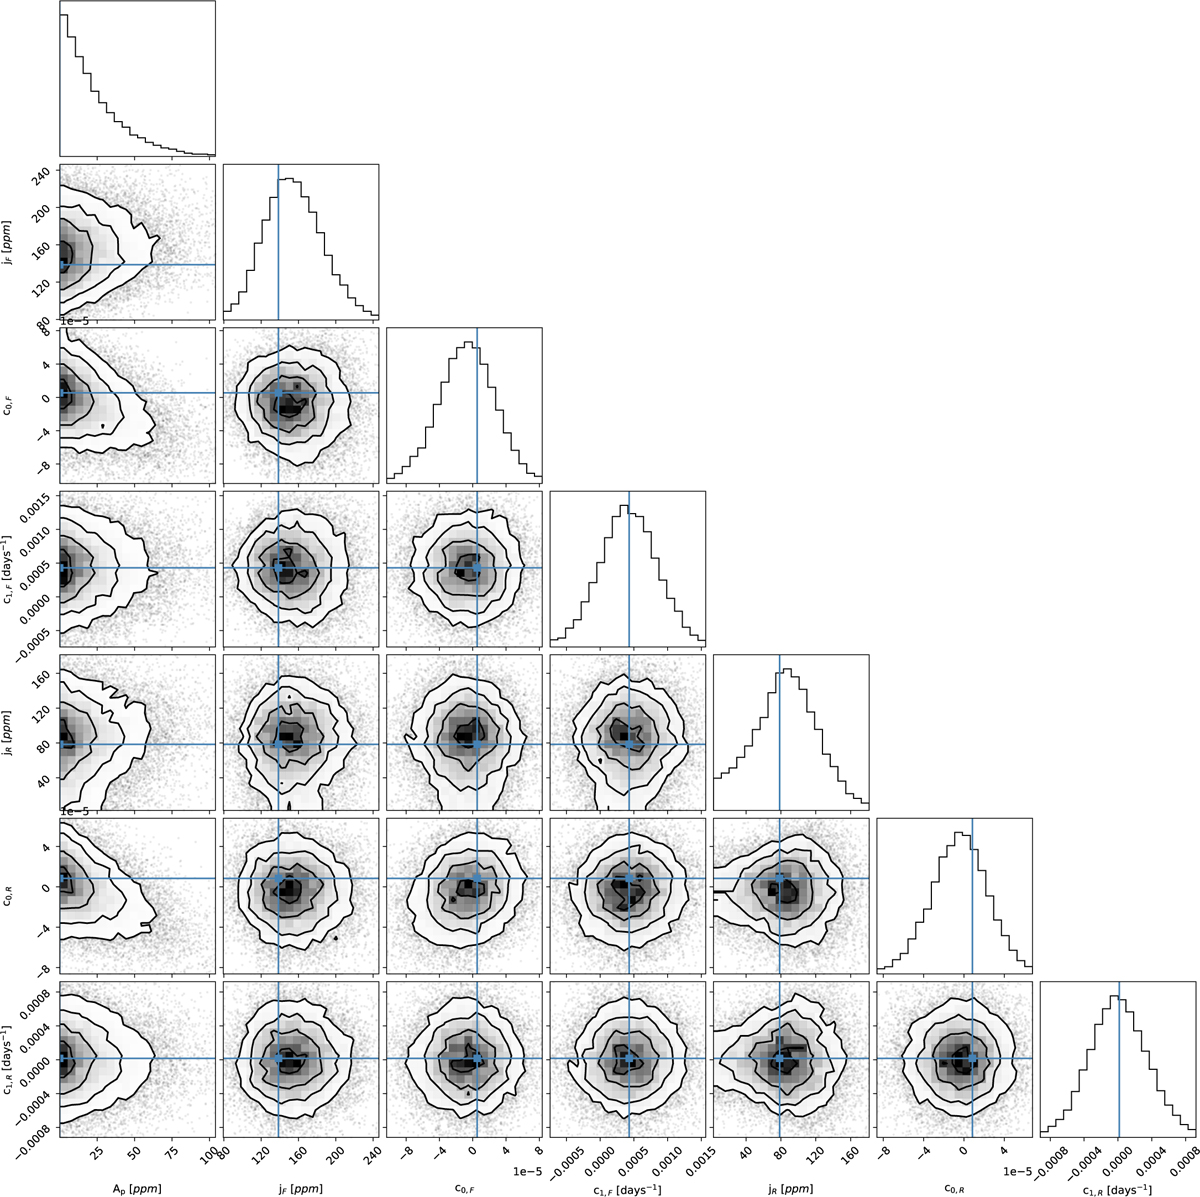
Corner plot of the MCMC chains from the fit of the HST WFC3/UVIS LCs (see Sect. 4.3). In each panel, the solid lines mark the MAP values. For plotting purposes, only the coefficients related to visit V1 are shown. The corner plots for the other visits are shown in the next figures. The posterior distribution of Ap is not shown here as it corresponds to what is shown in Fig. 8.
Current usage metrics show cumulative count of Article Views (full-text article views including HTML views, PDF and ePub downloads, according to the available data) and Abstracts Views on Vision4Press platform.
Data correspond to usage on the plateform after 2015. The current usage metrics is available 48-96 hours after online publication and is updated daily on week days.
Initial download of the metrics may take a while.