Fig. A.3
Download original image
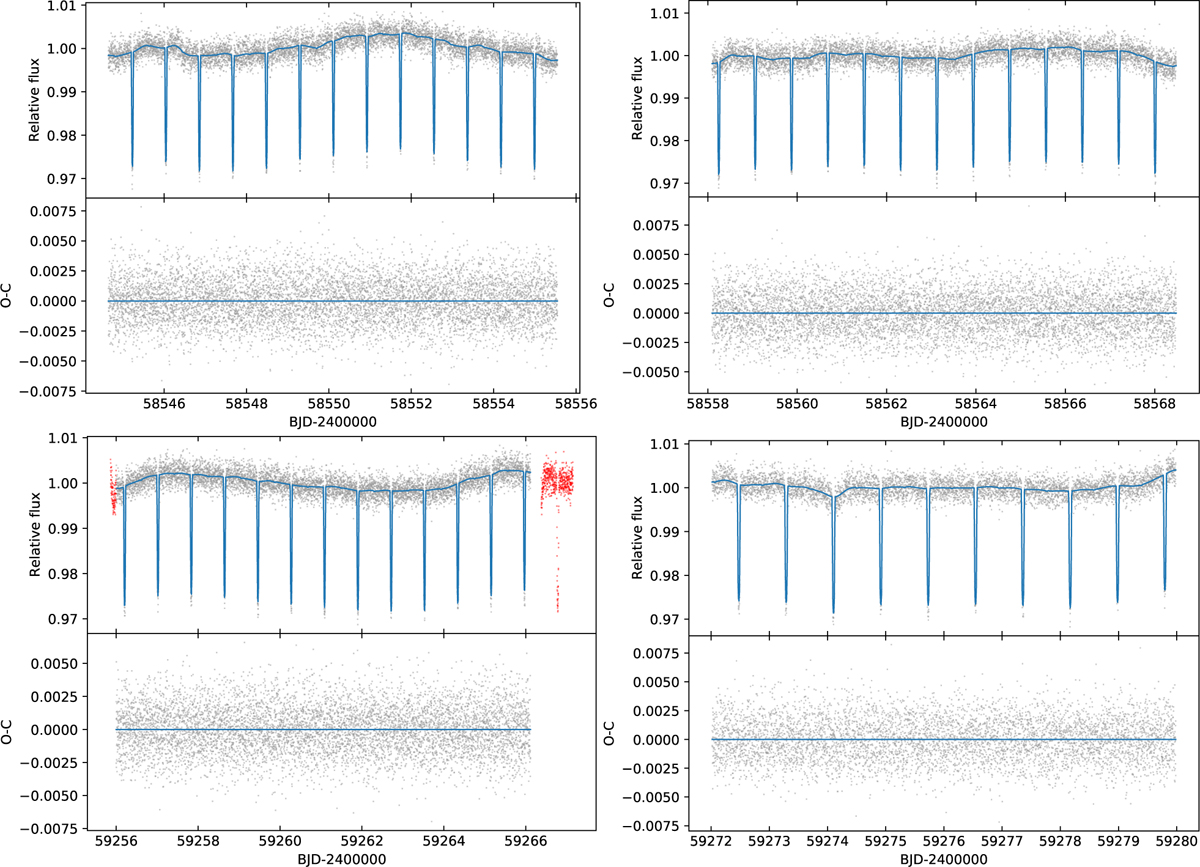
TESS LCs for orbits 25 (top left), 26 (top right), 77 (bottom left) and 78 (bottom right). For each panel, the top plot shows also the best fit model as a solid blue line, while the residuals are shown in the bottom plot. In the top plot of the bottom left panel we show in red the data rejected points. See Sect. 4.1 for details.
Current usage metrics show cumulative count of Article Views (full-text article views including HTML views, PDF and ePub downloads, according to the available data) and Abstracts Views on Vision4Press platform.
Data correspond to usage on the plateform after 2015. The current usage metrics is available 48-96 hours after online publication and is updated daily on week days.
Initial download of the metrics may take a while.