Fig. 10
Download original image
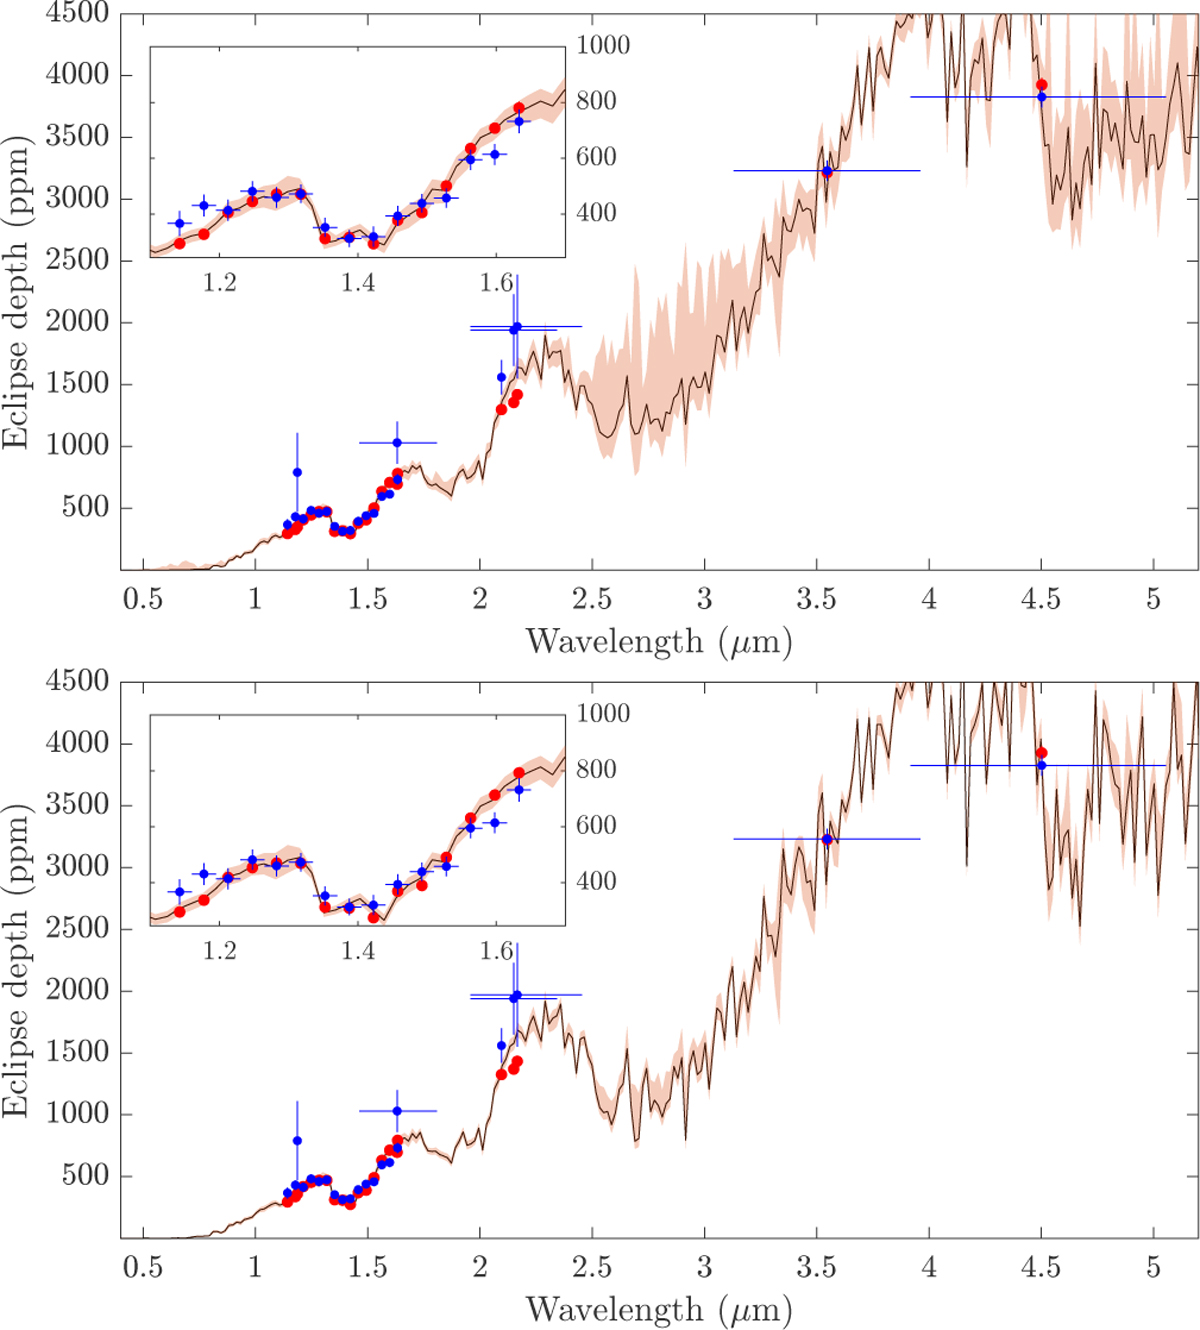
Posterior distributions of the spectra and bandpass-integrated eclipse depths in units of ppm of the retrieval. The spectra corresponding to the solar-metallicity and high-metallicity solutions (see Fig. 9) are shown in the top and bottom panel respectively. In each panel, the black line indicates the median spectrum, while the red, shaded area is the 1-σ interval. Blue points denote the measured eclipse depths with their corresponding error bars while red points are the median, bandpass-integrated values from the posterior spectra. Their red error bars again indicate their corresponding 3-σ intervals. The inset plot shows a magnification of the HST WFC3/G141 data.
Current usage metrics show cumulative count of Article Views (full-text article views including HTML views, PDF and ePub downloads, according to the available data) and Abstracts Views on Vision4Press platform.
Data correspond to usage on the plateform after 2015. The current usage metrics is available 48-96 hours after online publication and is updated daily on week days.
Initial download of the metrics may take a while.