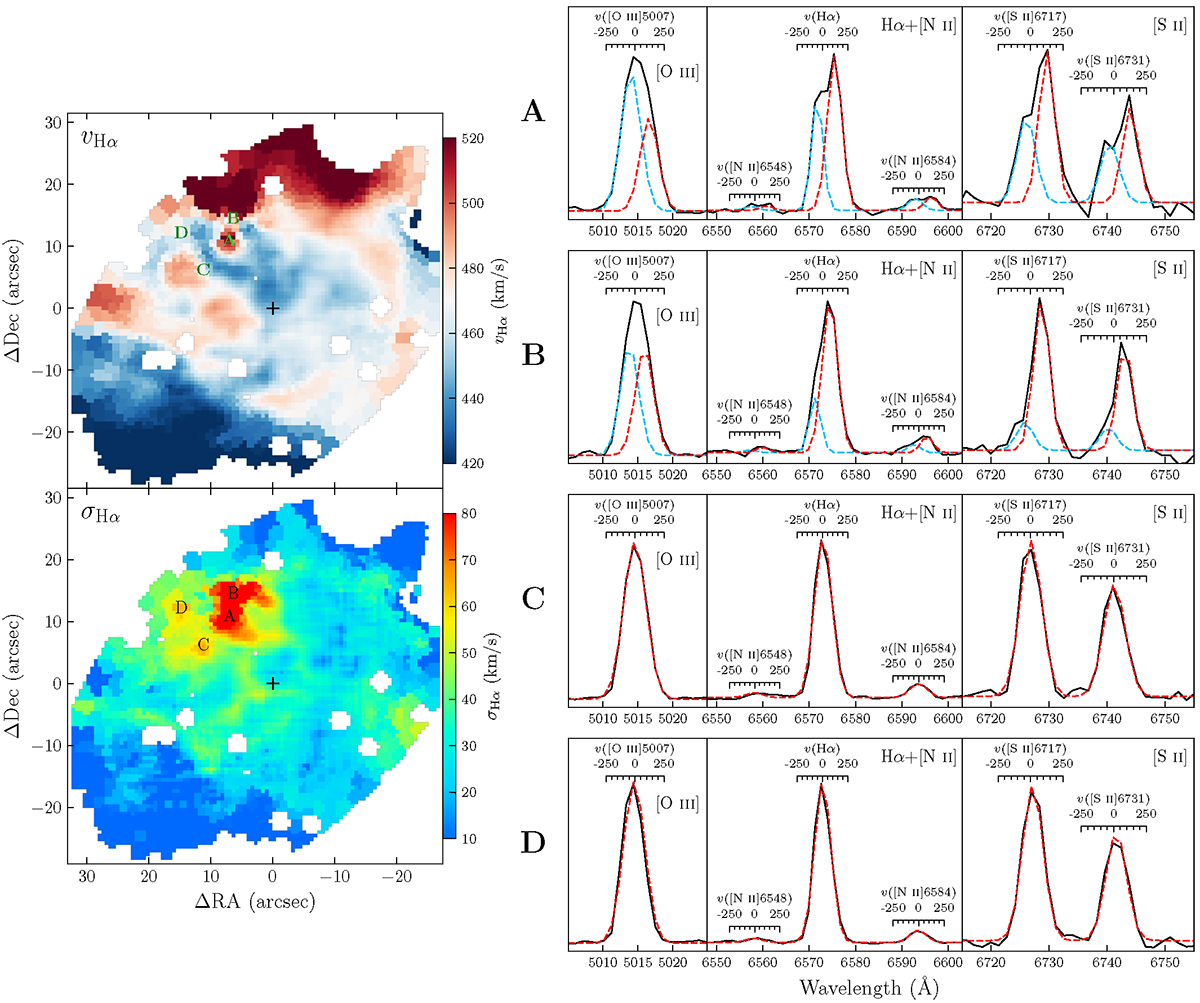
Fig. 7.
Download original image
Left column: Velocity field and velocity dispersion map of Hα emission line. The velocity dispersion is determined by enforcing single Gaussian profile fitting. Right column: Emission line profiles of [O III]λ5007, Hα, [N II]λλ6548,6584, and [S II]λλ6717,6731 of the four regions with the highest velocity dispersion, as indicated in the left panels. The dashed curves overplotted on the line profiles represent the best fit with either single or double Gaussian components. The velocity scale (in km s−1) for each spectral line profile is indicated in the right panels.
Current usage metrics show cumulative count of Article Views (full-text article views including HTML views, PDF and ePub downloads, according to the available data) and Abstracts Views on Vision4Press platform.
Data correspond to usage on the plateform after 2015. The current usage metrics is available 48-96 hours after online publication and is updated daily on week days.
Initial download of the metrics may take a while.