Fig. 6.
Download original image
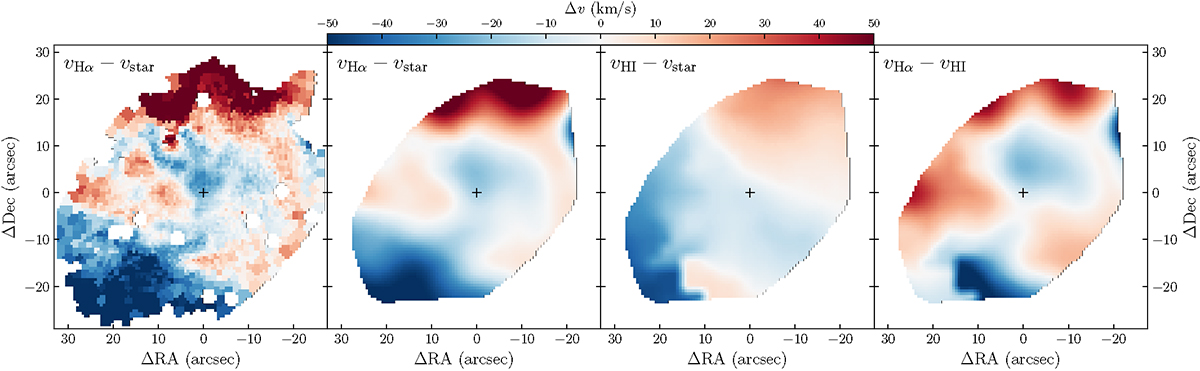
Velocity difference maps of the stellar and gaseous velocity fields. The left panel is the (υHα–υstar) map at the original spatial resolution of MUSE data, and the other three panels to the right are respectively the (υHα–υstar), (υH I–υstar) and (υHα–υH i) maps, where the MUSE data have been smoothed to match the spatial resolution (FWHM ∼ 18″) of H I data.
Current usage metrics show cumulative count of Article Views (full-text article views including HTML views, PDF and ePub downloads, according to the available data) and Abstracts Views on Vision4Press platform.
Data correspond to usage on the plateform after 2015. The current usage metrics is available 48-96 hours after online publication and is updated daily on week days.
Initial download of the metrics may take a while.