Fig. 15.
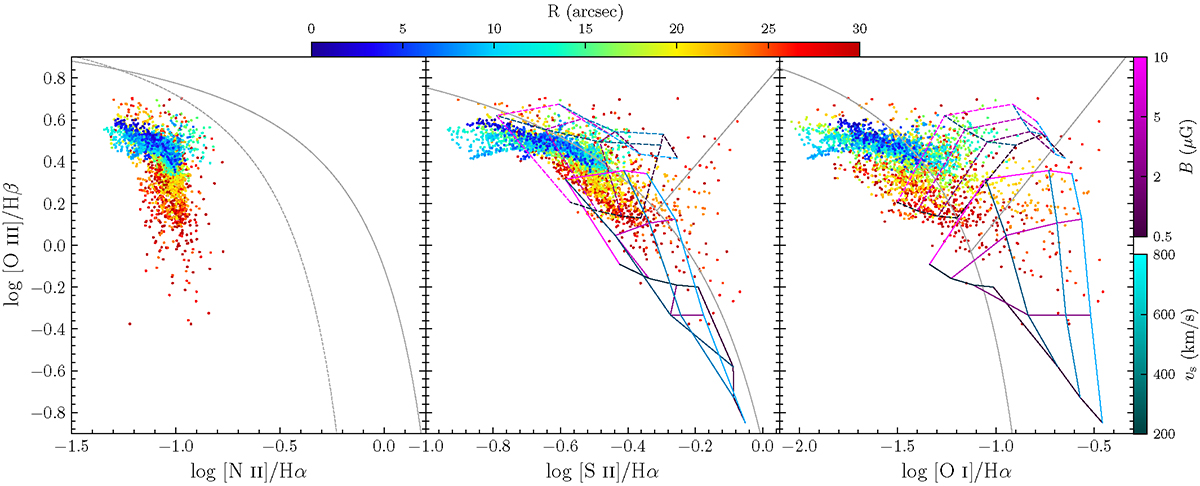
Download original image
The Veilleux & Osterbrock (1987) line-ratio diagnostic diagrams of NGC 2915. Each point represents one spaxel and color-coded by the galactocentric radius. The dashed curve in the first panel is the boundary between empirical pure H II region emission and “composite” emission proposed by Kauffmann et al. (2003). The solid curves in the three panels are the Kewley et al. (2001) maximum starburst line. The gray straight lines in the middle and right panels are the empirical boundary between Seyferts and LI(N)ERs proposed by Kewley et al. (2006). The model grids are the MAPPINGS III shock (solid grids) and shock+precursor (dashed grids) models from (Allen et al. 2008) for a SMC-like metallicity. The grid lines are color-coded according to shock velocity vs and magnetic field B.
Current usage metrics show cumulative count of Article Views (full-text article views including HTML views, PDF and ePub downloads, according to the available data) and Abstracts Views on Vision4Press platform.
Data correspond to usage on the plateform after 2015. The current usage metrics is available 48-96 hours after online publication and is updated daily on week days.
Initial download of the metrics may take a while.