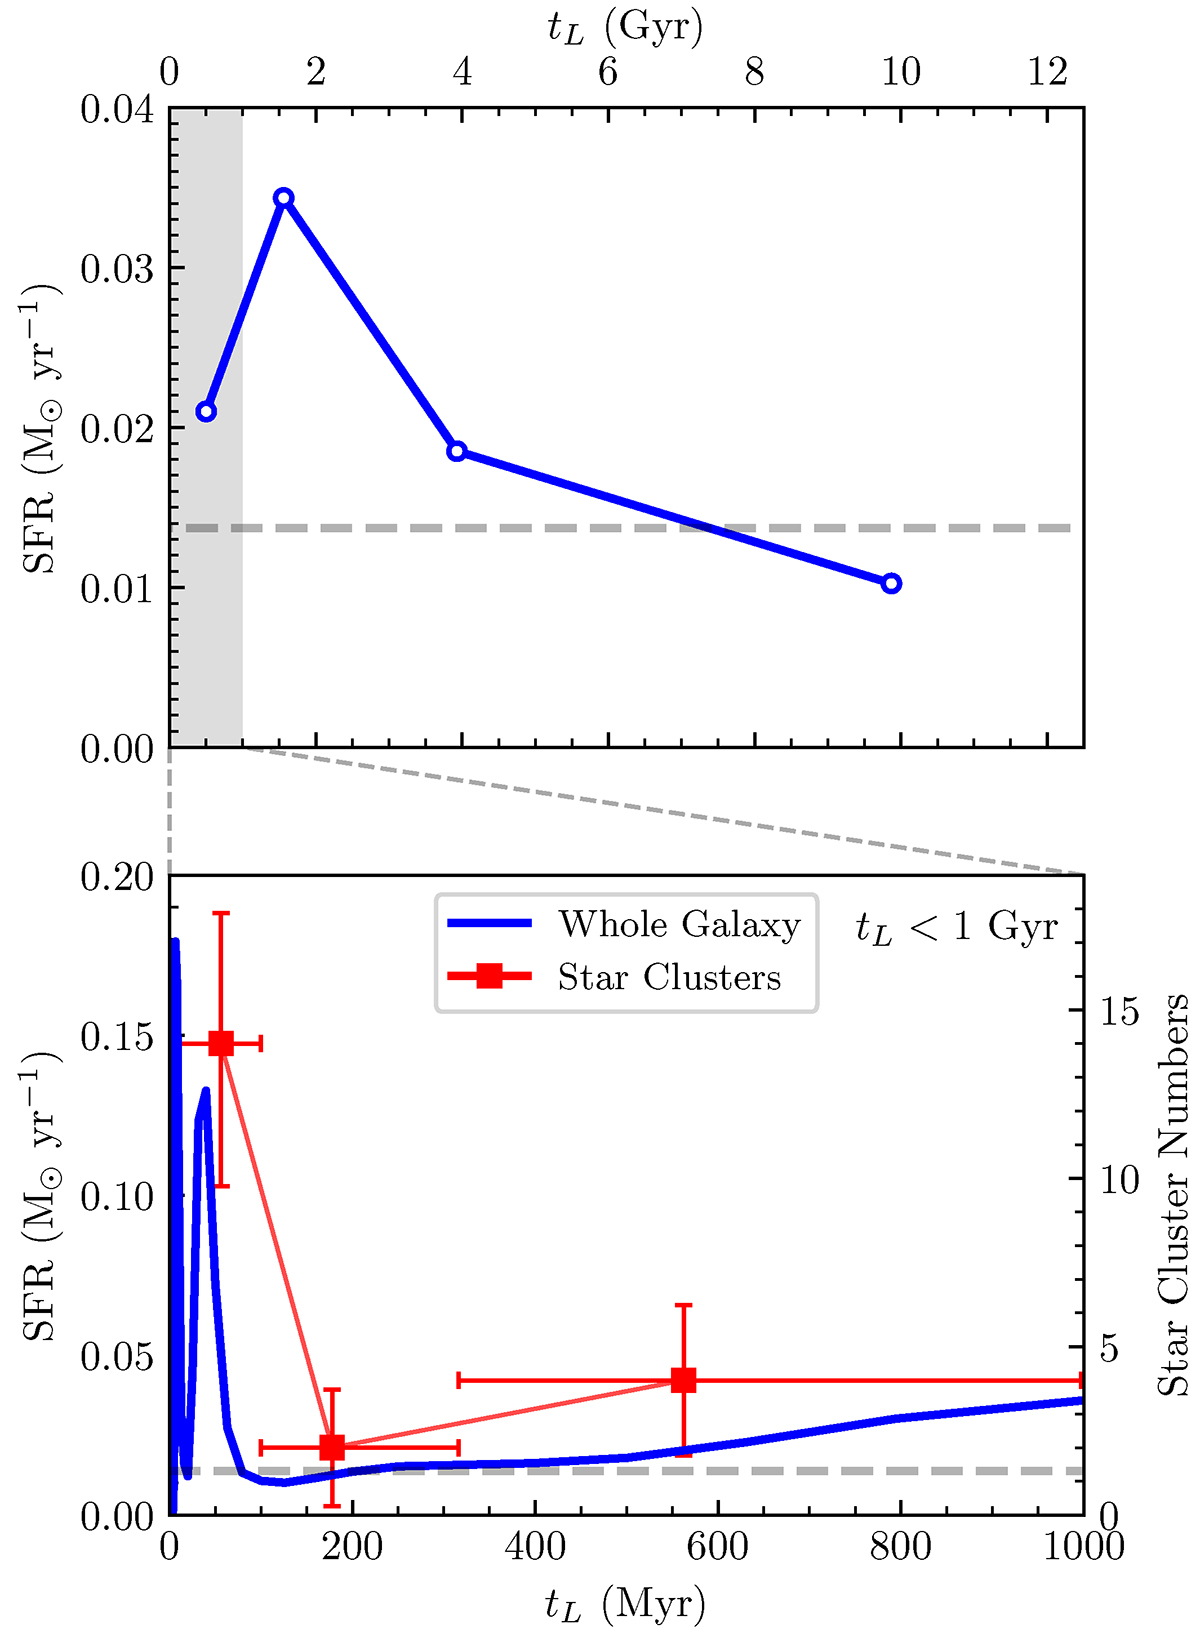
Fig. 14.
Download original image
Integrated star formation history of the whole galaxy (blue) and the age distribution of star clusters (red, bottom panel). The bottom panel is an enlarged view of the last 1 Gyr. The leftmost data point of the top panel represents the average star formation rate of the last 1 Gyr, and the other three points correspond to the star formation rate averaged over logarithmic age intervals of 0.4 dex. In the lower panel, the red horizontal error bars correspond to the (logarithmic) age intervals used for cluster counting, while the red vertical error bars account for the measurement uncertainties of ages and counting noise.
Current usage metrics show cumulative count of Article Views (full-text article views including HTML views, PDF and ePub downloads, according to the available data) and Abstracts Views on Vision4Press platform.
Data correspond to usage on the plateform after 2015. The current usage metrics is available 48-96 hours after online publication and is updated daily on week days.
Initial download of the metrics may take a while.