Fig. 13.
Download original image
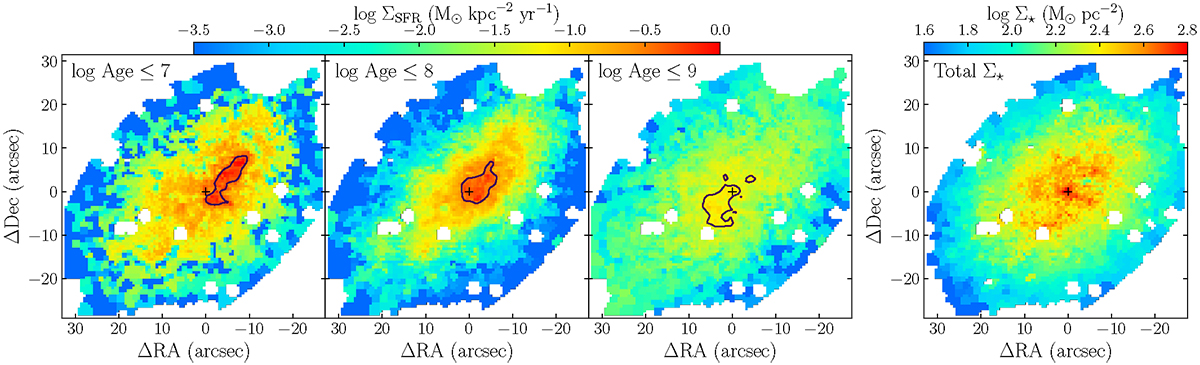
Spatial distribution of star formation rate averaged over different timescales. Left three panels: Surface density distributions of star formation rate averaged over the last 107, 108 and 109 yr (i.e., the birth mass of stars younger than the age limits divided by the age limits), respectively. The black contours overplotted in the left three panels correspond to 50% of the maximum ΣSFR. Rightmost panel: Surface density distribution of stellar mass.
Current usage metrics show cumulative count of Article Views (full-text article views including HTML views, PDF and ePub downloads, according to the available data) and Abstracts Views on Vision4Press platform.
Data correspond to usage on the plateform after 2015. The current usage metrics is available 48-96 hours after online publication and is updated daily on week days.
Initial download of the metrics may take a while.