Fig. 12.
Download original image
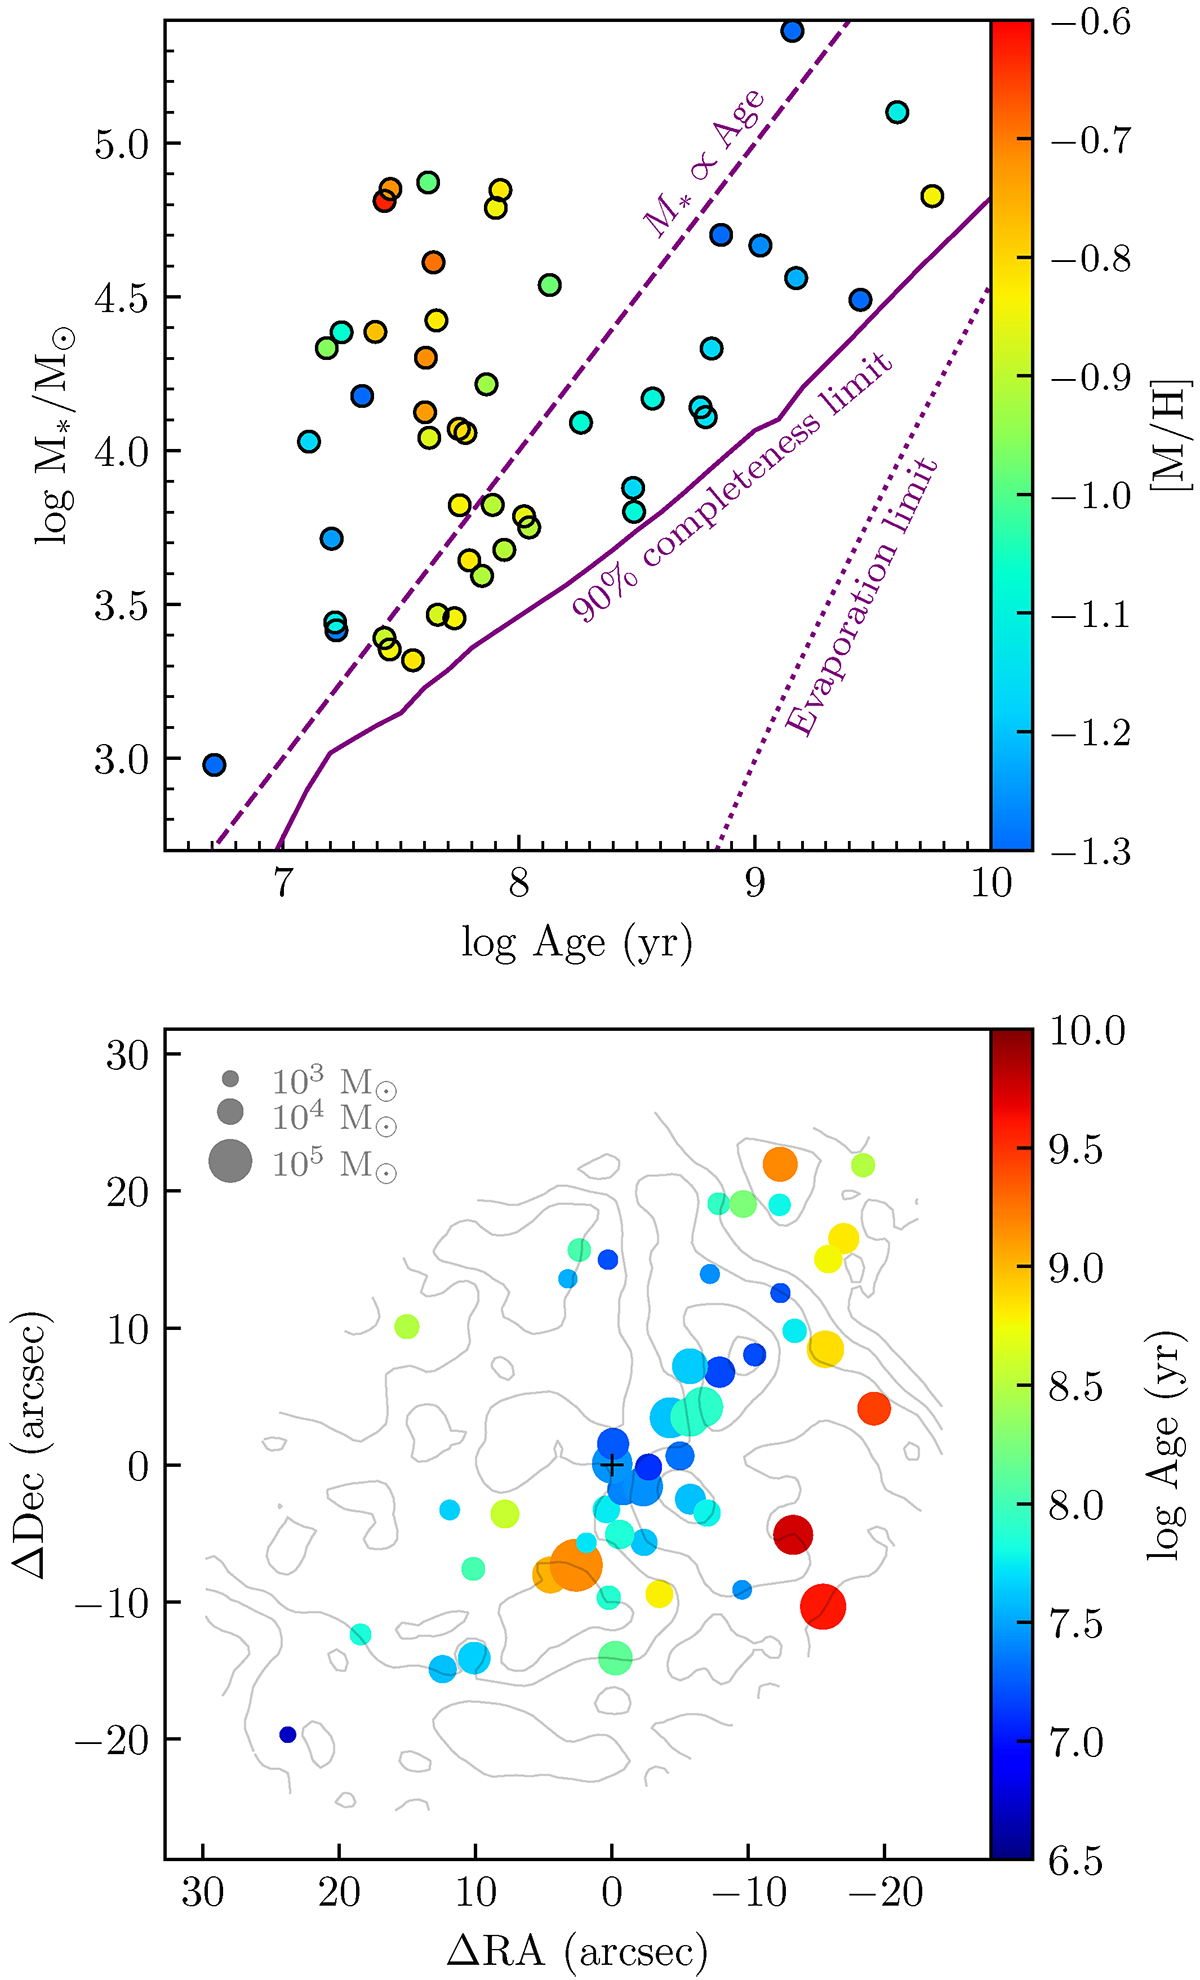
Star cluster distributions of NGC 2915. Top: distribution of star clusters in the mass–age plane. The plotted mass is the mass at birth. Each circle is a star cluster color-coded by its metallicity. The purple solid curve is the 90% mass completeness limit converted from the V = 22.8 mag brightness limit by using age-dependent mass-to-light ratios. The purple dashed line is plotted as a guide for the expected relation between maximum cluster mass and age by assuming a fiducial cluster mass function and constant cluster formation history. The dynamical evaporation limit is derived using a galactocentric radius of 0.47 kpc (24 arcsec) and a rotation velocity of 15 km s−1, as appropriate for the inner disk of NGC 2915. Bottom: spatial distribution of star clusters color-coded by the stellar age. The filled circles are plotted with sizes proportional to the fourth root of stellar mass. The EW(Hα) distribution is overplotted as contours.
Current usage metrics show cumulative count of Article Views (full-text article views including HTML views, PDF and ePub downloads, according to the available data) and Abstracts Views on Vision4Press platform.
Data correspond to usage on the plateform after 2015. The current usage metrics is available 48-96 hours after online publication and is updated daily on week days.
Initial download of the metrics may take a while.