Fig. 1.
Download original image
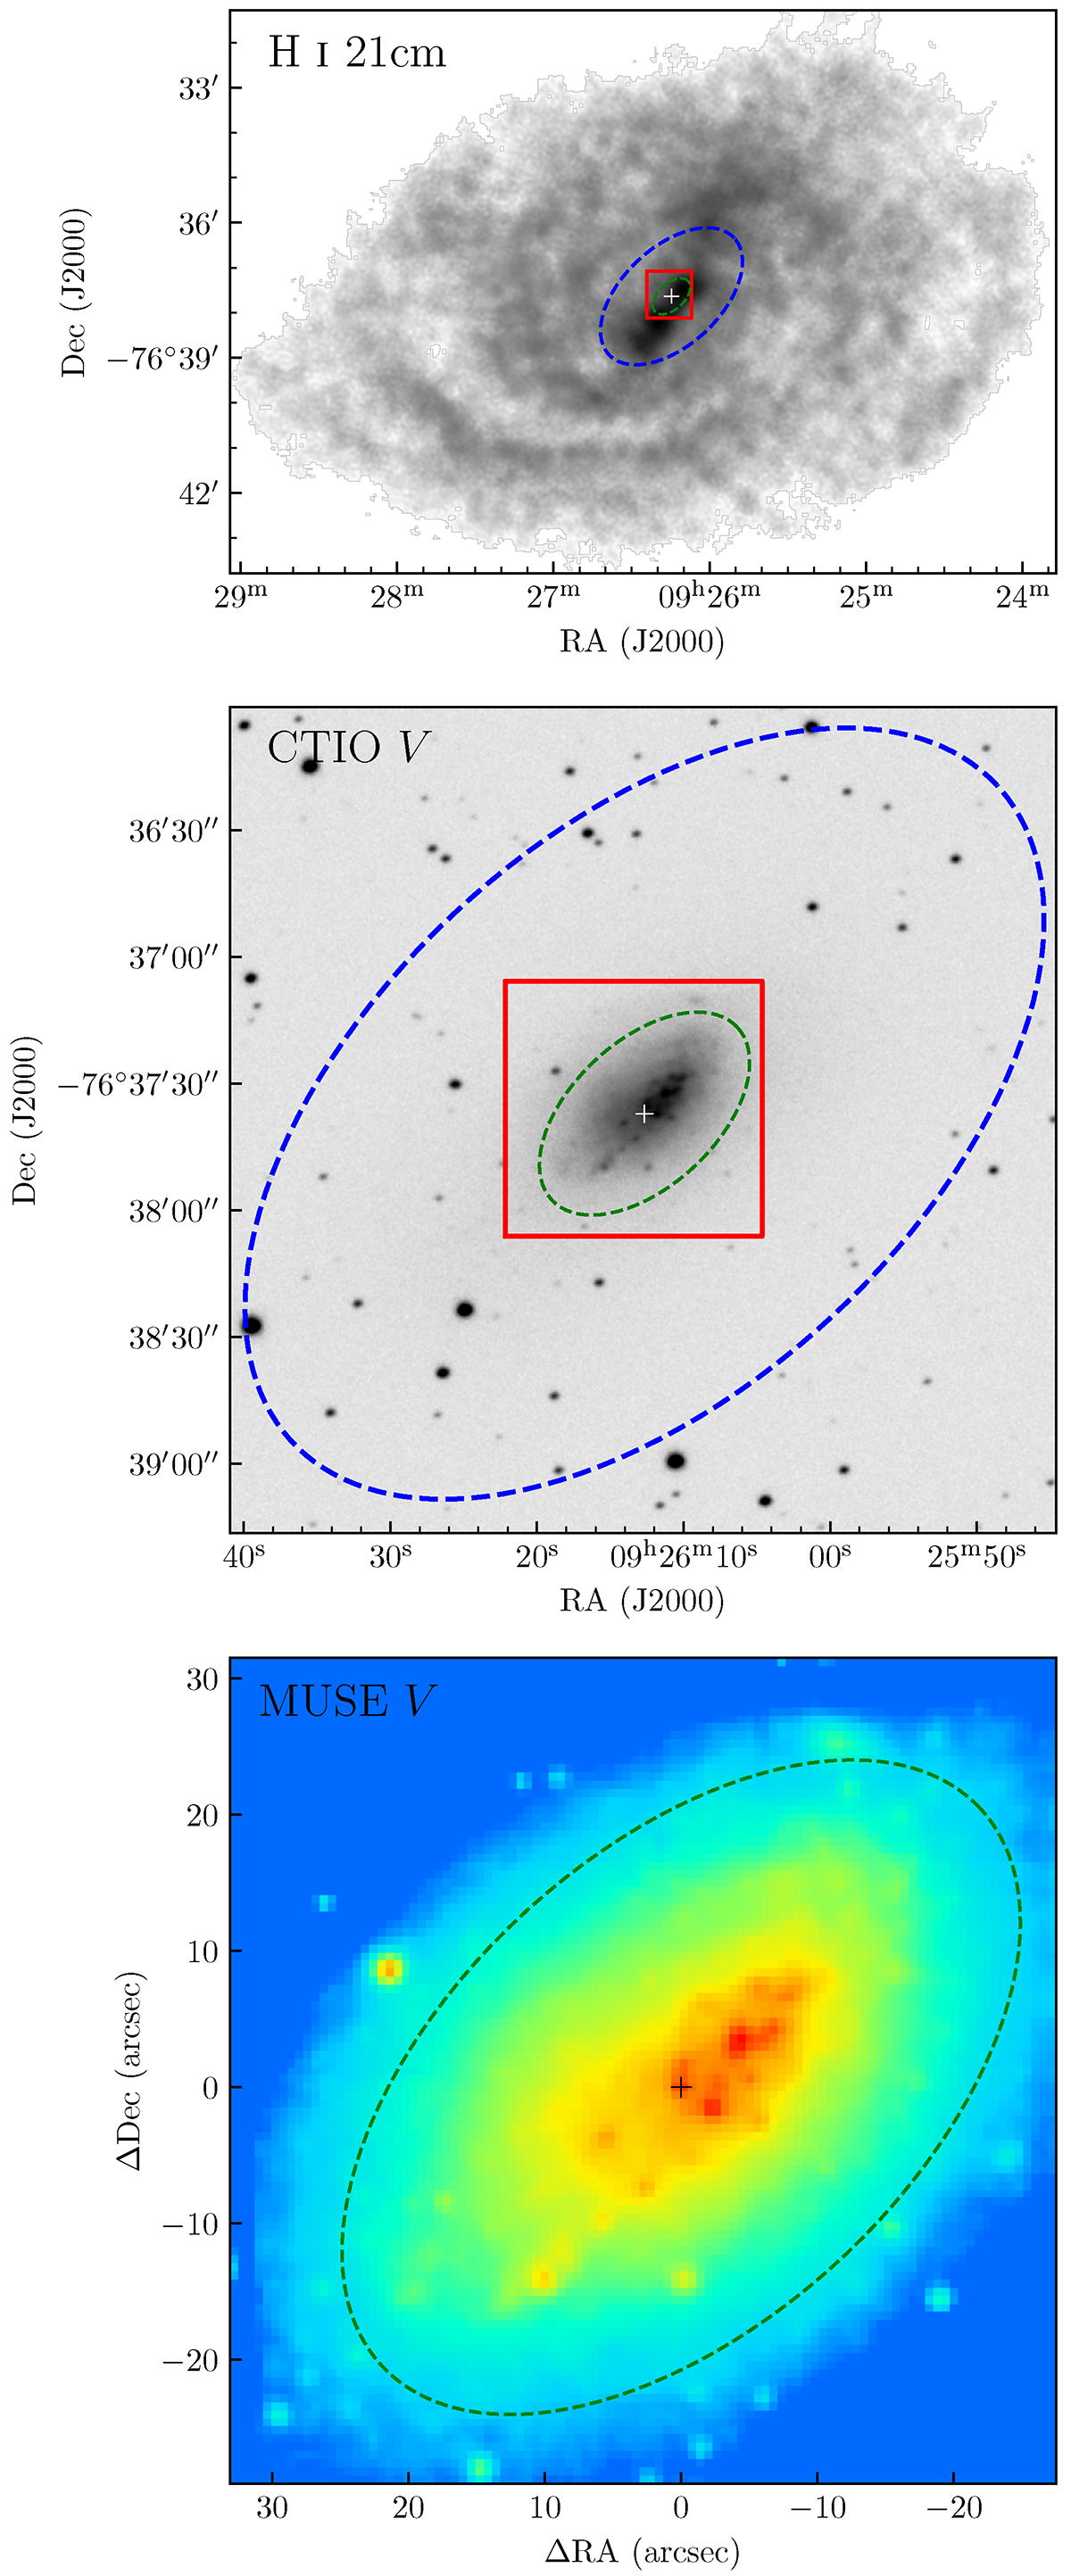
From top to bottom: H I intensity map of NGC 2915 obtained from the Australia Telescope Compact Array by Elson et al. (2010), V-band image from the Cerro Tololo Inter-American Observatory’s 1.5 m telescope in the Spitzer Nearby Galaxies Survey (SINGS, Kennicutt et al. 2003), and V-band image obtained by collapsing the wavelength dimension of the MUSE data cube. In all panels, the blue and green dashed ellipses represent the Holmberg radius and the break radius of the up-bending surface brightness profile of NGC 2915, respectively. The MUSE FoV is plotted as a red box, which measures ∼1.2 × 1.2 kpc at the distance of NGC 2915. The galactic center is marked as a black cross and the same for all following plots.
Current usage metrics show cumulative count of Article Views (full-text article views including HTML views, PDF and ePub downloads, according to the available data) and Abstracts Views on Vision4Press platform.
Data correspond to usage on the plateform after 2015. The current usage metrics is available 48-96 hours after online publication and is updated daily on week days.
Initial download of the metrics may take a while.