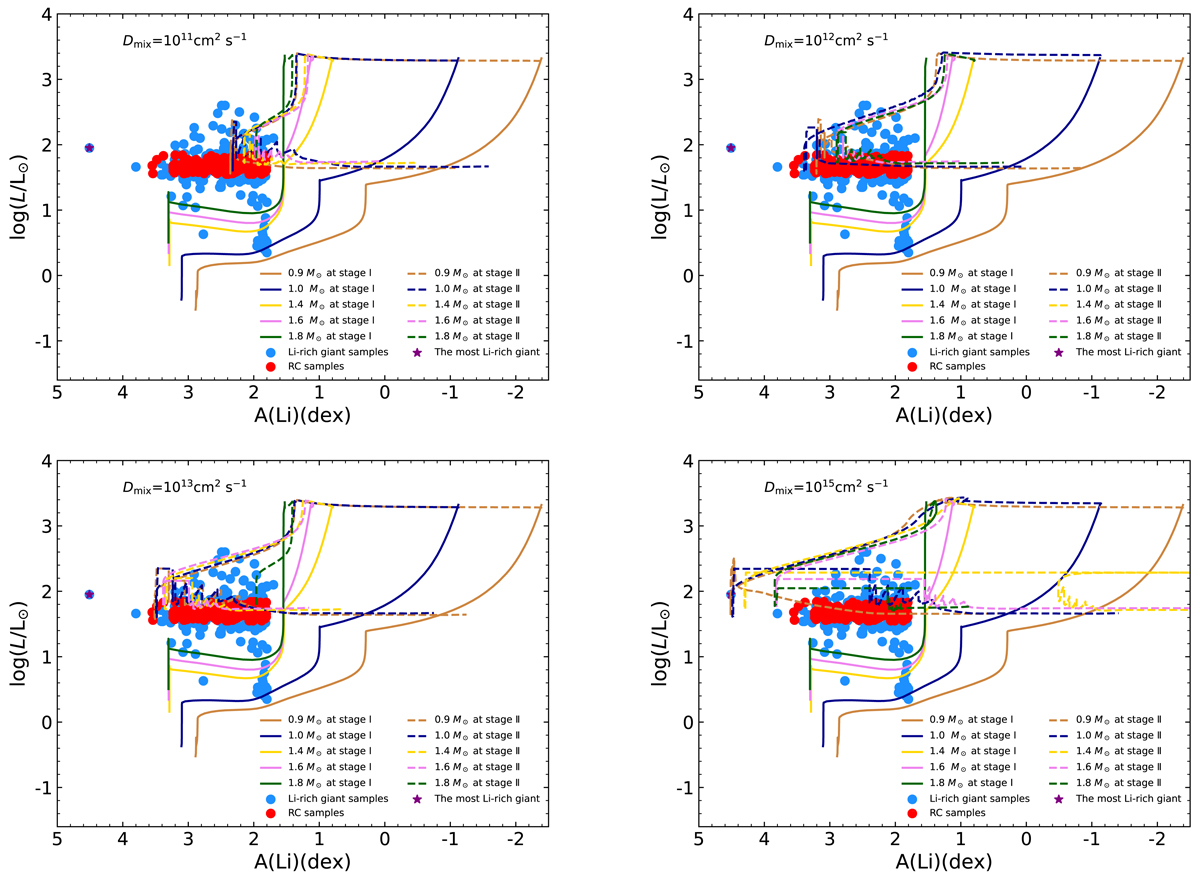
Fig. 4.
Download original image
Similar to Fig. 1, but for the models with different masses and constant diffusive mixing coefficients of Dmix to 1011 cm2 s−1, 1012 cm2 s−1, 1013 cm2 s−1, and 1015 cm2 s−1. Different values are displayed in the upper left corner of each subgraph. The solid and dashed lines show the evolutional tracks at Stages I and II, respectively. The red and blue circles are the Li-rich giant stars and the RC stars listed in Table 1, respectively. The star represents the most Li-rich giant star, TYC 429-2097-1, observed by Yan et al. (2018).
Current usage metrics show cumulative count of Article Views (full-text article views including HTML views, PDF and ePub downloads, according to the available data) and Abstracts Views on Vision4Press platform.
Data correspond to usage on the plateform after 2015. The current usage metrics is available 48-96 hours after online publication and is updated daily on week days.
Initial download of the metrics may take a while.