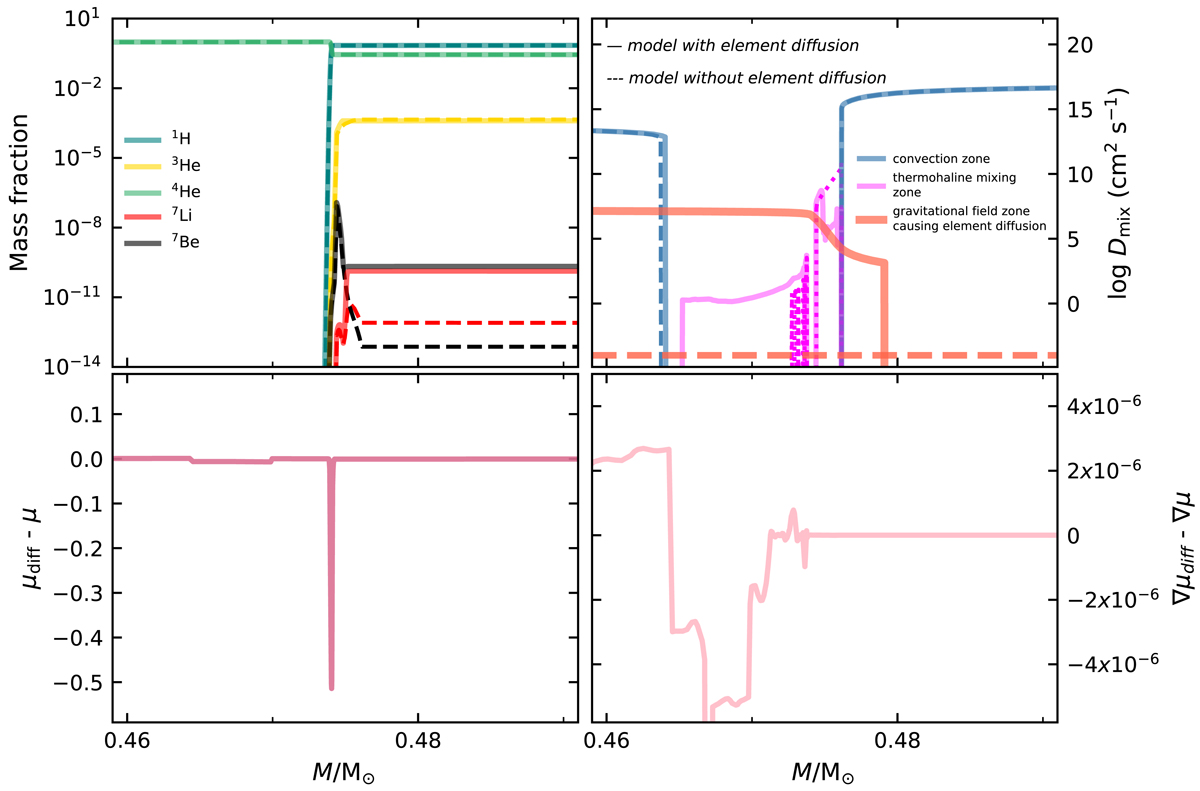
Fig. 2.
Download original image
Profiles of element abundances (top left corner) and diffusion coefficients (top right corner) (Dmix) at the first He flash. The solid lines are for the model with element diffusion, and the dashed lines are for model without element diffusion. The left and right panels at the bottom show the relative changes between the mean molecular weights (μdiff and μ) with and without element diffusion, and between the mean molecular weight gradients (∇μdiff and ∇μ) with and without element diffusion, respectively.
Current usage metrics show cumulative count of Article Views (full-text article views including HTML views, PDF and ePub downloads, according to the available data) and Abstracts Views on Vision4Press platform.
Data correspond to usage on the plateform after 2015. The current usage metrics is available 48-96 hours after online publication and is updated daily on week days.
Initial download of the metrics may take a while.