Fig. 5
Download original image
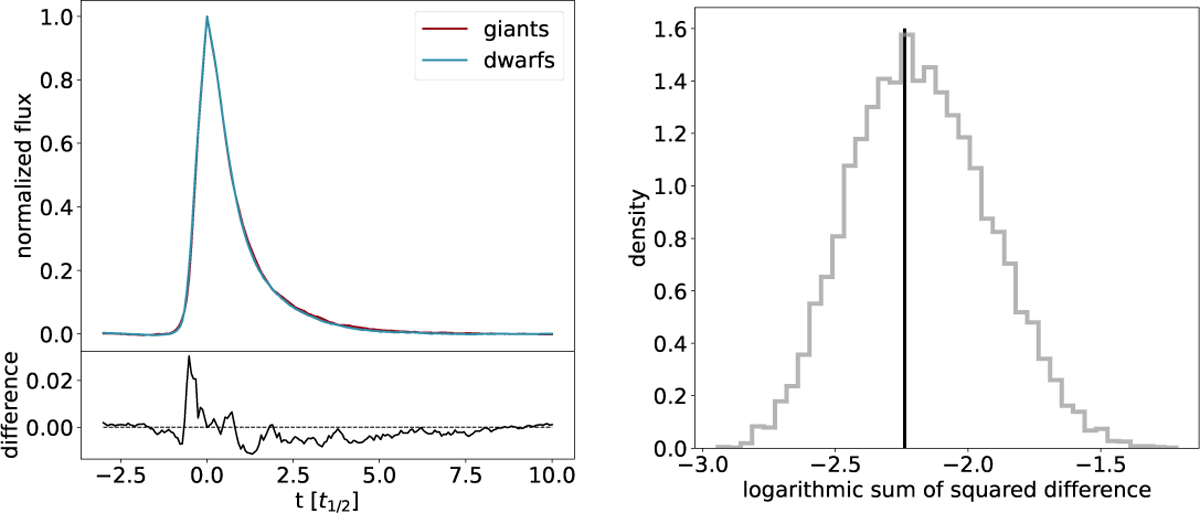
Median flare shapes after correcting for the different t1/2 distributions, and leaving out the complex flares. Left: scaled flare shapes and differences for an illustrative random permutation of the sample. Right: distribution of the sum of squared differences from 10 000 random resamples. The vertical line denotes the measured value from the original.
Current usage metrics show cumulative count of Article Views (full-text article views including HTML views, PDF and ePub downloads, according to the available data) and Abstracts Views on Vision4Press platform.
Data correspond to usage on the plateform after 2015. The current usage metrics is available 48-96 hours after online publication and is updated daily on week days.
Initial download of the metrics may take a while.