| Issue |
A&A
Volume 694, February 2025
|
|
|---|---|---|
| Article Number | C3 | |
| Number of page(s) | 1 | |
| Section | Stellar atmospheres | |
| DOI | https://doi.org/10.1051/0004-6361/202553933e | |
| Published online | 11 February 2025 | |
Characteristics of flares on giant stars (Corrigendum)
1
Konkoly Observatory, HUN-REN Research Centre for Astronomy and Earth Sciences,
Konkoly Thege Miklós út 15-17,
1121
Budapest,
Hungary
2
HUN-REN CSFK, MTA Centre of Excellence,
Konkoly Thege Miklós út 15-17,
1121
Budapest,
Hungary
3
Eötvös University, Department of Astronomy,
Pf. 32,
1518
Budapest,
Hungary
★ Corresponding authors; This email address is being protected from spambots. You need JavaScript enabled to view it.
Key words: stars: activity / stars: flare / stars: late-type / errata, addenda
1 Erratum
In Section 3.2 of the published paper, the median flare shapes of giant and dwarf stars were compared. We resampled the flares of giants and dwarfs to have similar t1/2 distributions. However, due to an indexing error, the similarity metric (the sum of the squared differences) was calculated for a shuffled sample. As a result, the right panel of Fig. 5 in the paper indicated that the flare shapes of giants and dwarfs are similar, whereas the opposite is suggested by the data. The corrected version of the plot is shown in Fig. 1. The corrected difference amounts to ~4σ, making the difference between the scaled flare shapes of giants and dwarfs significant. We note that resampling the t1/2 distributions to be similar makes little difference for this conclusion. We apologize for any inconvenience caused by this error.
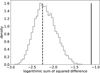 |
Fig. 1 Difference between the flare shapes of giants and dwarfs. The similarity metric calculated for the real dataset is shown with the vertical black line, and the distribution calculated from randomly shuffling the data is shown by the grey histogram. The dashed line shows the erroneous value from the paper. |
© The Authors 2025
 Open Access article, published by EDP Sciences, under the terms of the Creative Commons Attribution License (https://creativecommons.org/licenses/by/4.0), which permits unrestricted use, distribution, and reproduction in any medium, provided the original work is properly cited.
This article is published in open access under the Subscribe to Open model. This email address is being protected from spambots. You need JavaScript enabled to view it. to support open access publication.
All Figures
|
Fig. 1 Difference between the flare shapes of giants and dwarfs. The similarity metric calculated for the real dataset is shown with the vertical black line, and the distribution calculated from randomly shuffling the data is shown by the grey histogram. The dashed line shows the erroneous value from the paper. |
| In the text | |
Current usage metrics show cumulative count of Article Views (full-text article views including HTML views, PDF and ePub downloads, according to the available data) and Abstracts Views on Vision4Press platform.
Data correspond to usage on the plateform after 2015. The current usage metrics is available 48-96 hours after online publication and is updated daily on week days.
Initial download of the metrics may take a while.