Fig. 1
Download original image
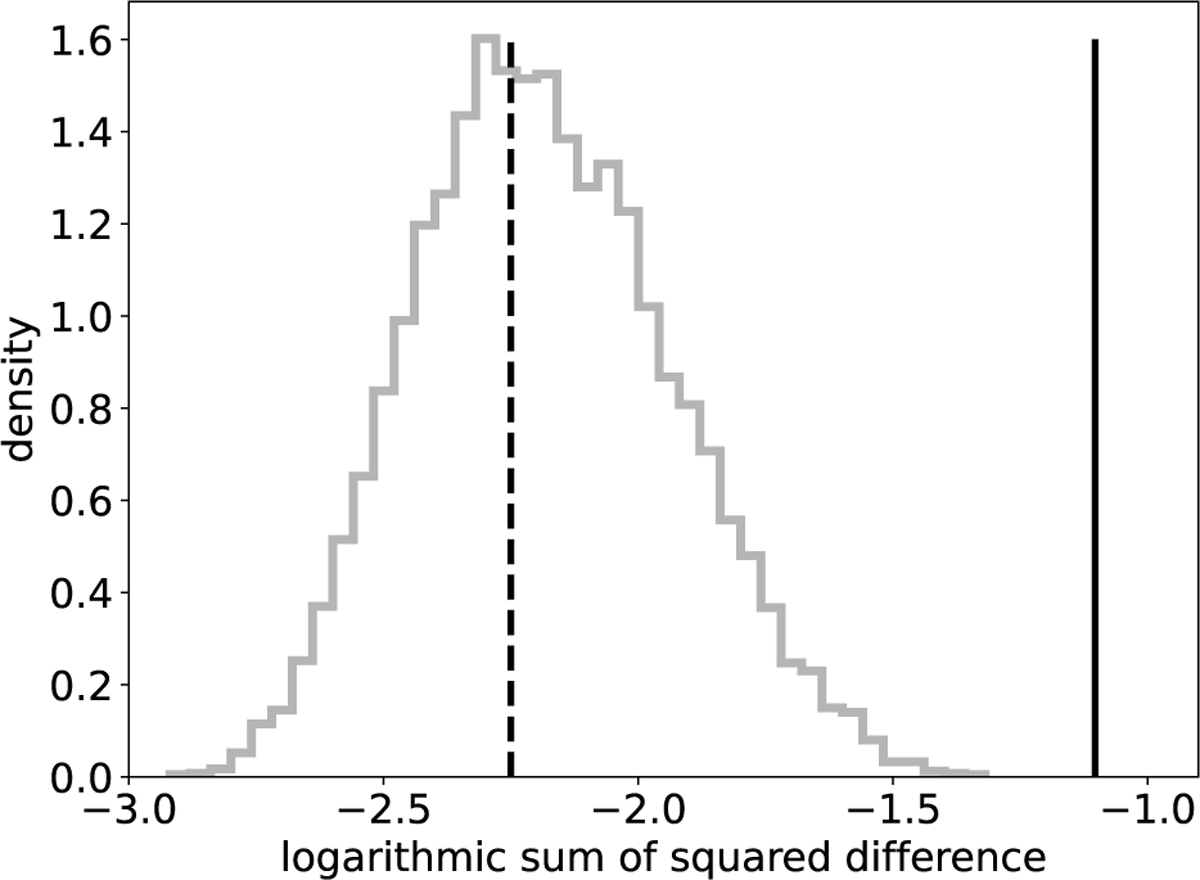
Difference between the flare shapes of giants and dwarfs. The similarity metric calculated for the real dataset is shown with the vertical black line, and the distribution calculated from randomly shuffling the data is shown by the grey histogram. The dashed line shows the erroneous value from the paper.
Current usage metrics show cumulative count of Article Views (full-text article views including HTML views, PDF and ePub downloads, according to the available data) and Abstracts Views on Vision4Press platform.
Data correspond to usage on the plateform after 2015. The current usage metrics is available 48-96 hours after online publication and is updated daily on week days.
Initial download of the metrics may take a while.