Fig. 2
Download original image
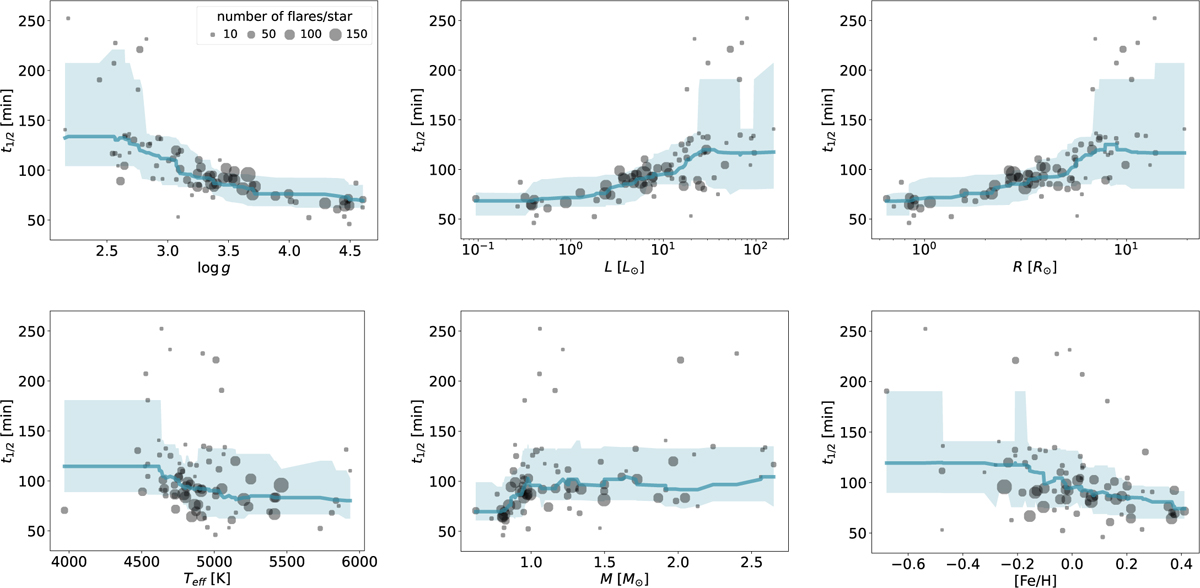
Change in the t1/2 flare duration proxy with log g surface gravity, L luminosity, R radius, Teff effective temperature, M mass, and [Fe/H] metallicity, for the Kepler 30 min sample of flaring stars from Paper I. Each dot represents the median t1/2 value of the observed flares for a given star, and the corresponding dot size is proportional to the number of flares. The scale is shown in the upper left panel. The blue lines and shades show the running median and the 16th to 84th percentiles, respectively.
Current usage metrics show cumulative count of Article Views (full-text article views including HTML views, PDF and ePub downloads, according to the available data) and Abstracts Views on Vision4Press platform.
Data correspond to usage on the plateform after 2015. The current usage metrics is available 48-96 hours after online publication and is updated daily on week days.
Initial download of the metrics may take a while.