Fig. 1
Download original image
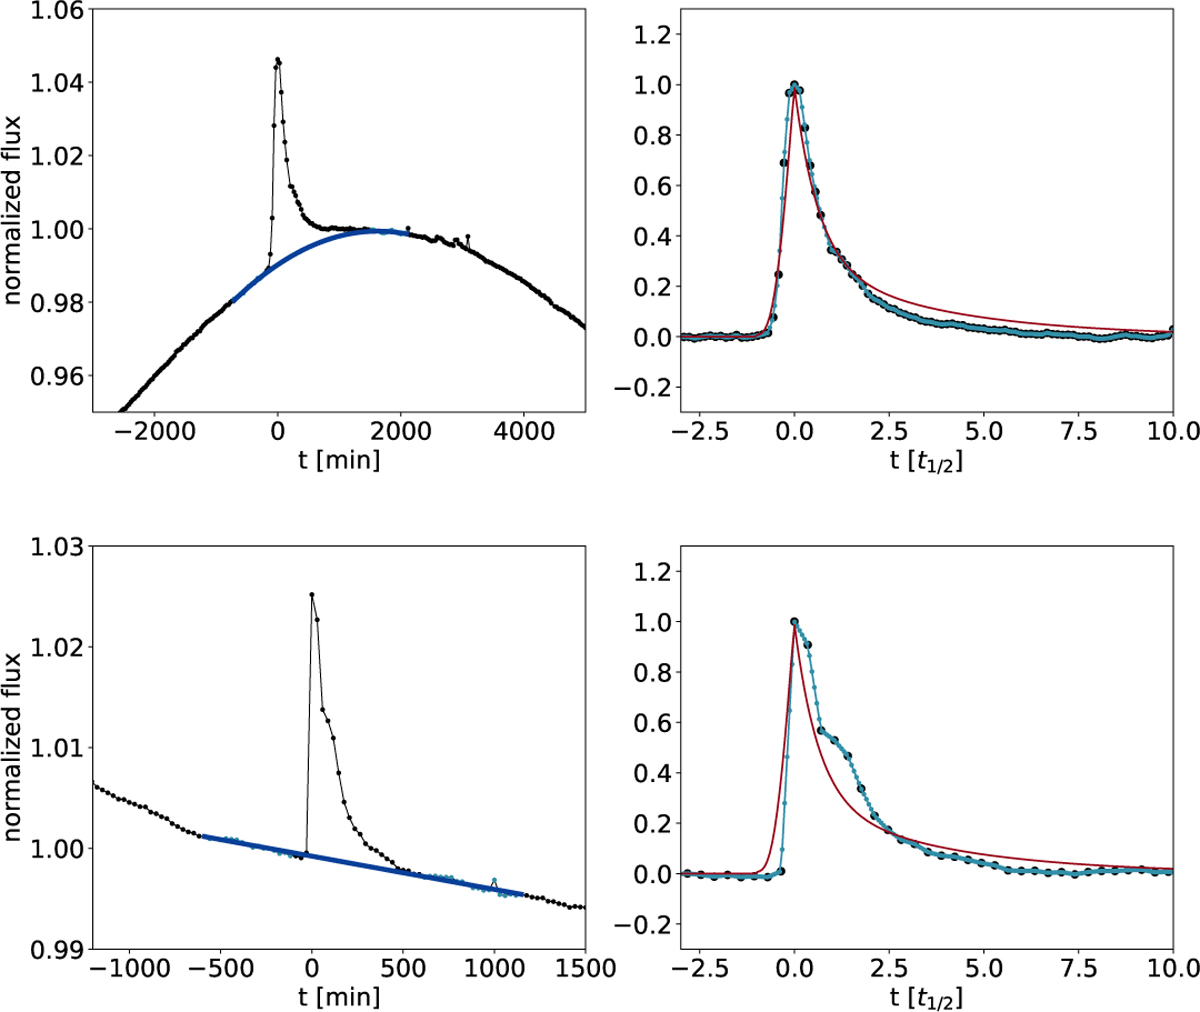
Example of the extraction procedure. Left panels: original dataset. The dark blue line shows the polynomial fit to the quiescent region, marked with light blue points. Right panels: extracted flares and the template that was used to scale the time (red line). Black points show the original data points, and light blue points show the interpolated light curve.
Current usage metrics show cumulative count of Article Views (full-text article views including HTML views, PDF and ePub downloads, according to the available data) and Abstracts Views on Vision4Press platform.
Data correspond to usage on the plateform after 2015. The current usage metrics is available 48-96 hours after online publication and is updated daily on week days.
Initial download of the metrics may take a while.