Fig. 6.
Download original image
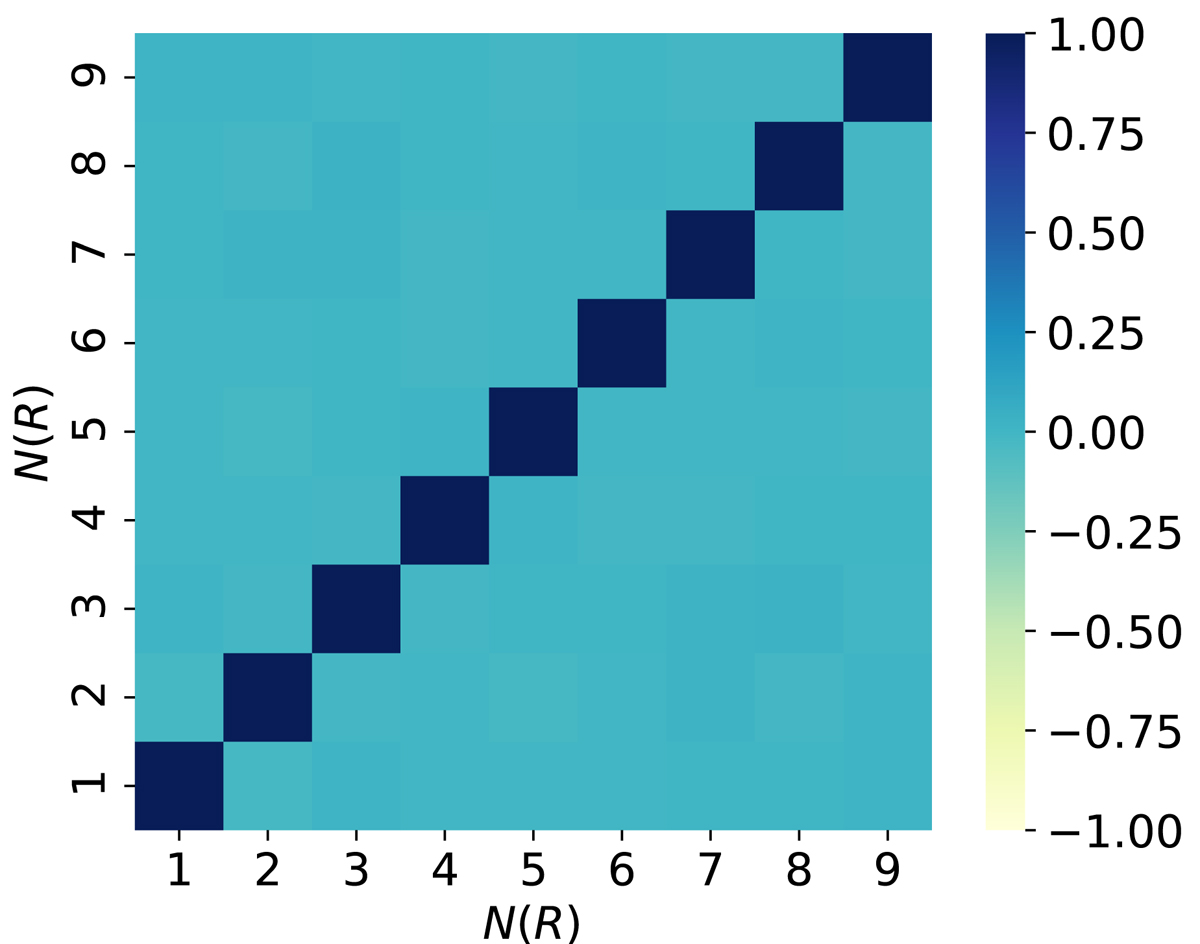
Correlation matrix propagated from the estimated ΔΣ variance matrix of FLS in different radial bins according to the pipeline of bootstrapping. The label N(R) represents nine radial bins from approximately 0.03–1.2 h−1 Mpc. The colours from light yellow to deep blue indicate that the correlations of ΔΣ between radial bins are from weak to strong, respectively.
Current usage metrics show cumulative count of Article Views (full-text article views including HTML views, PDF and ePub downloads, according to the available data) and Abstracts Views on Vision4Press platform.
Data correspond to usage on the plateform after 2015. The current usage metrics is available 48-96 hours after online publication and is updated daily on week days.
Initial download of the metrics may take a while.