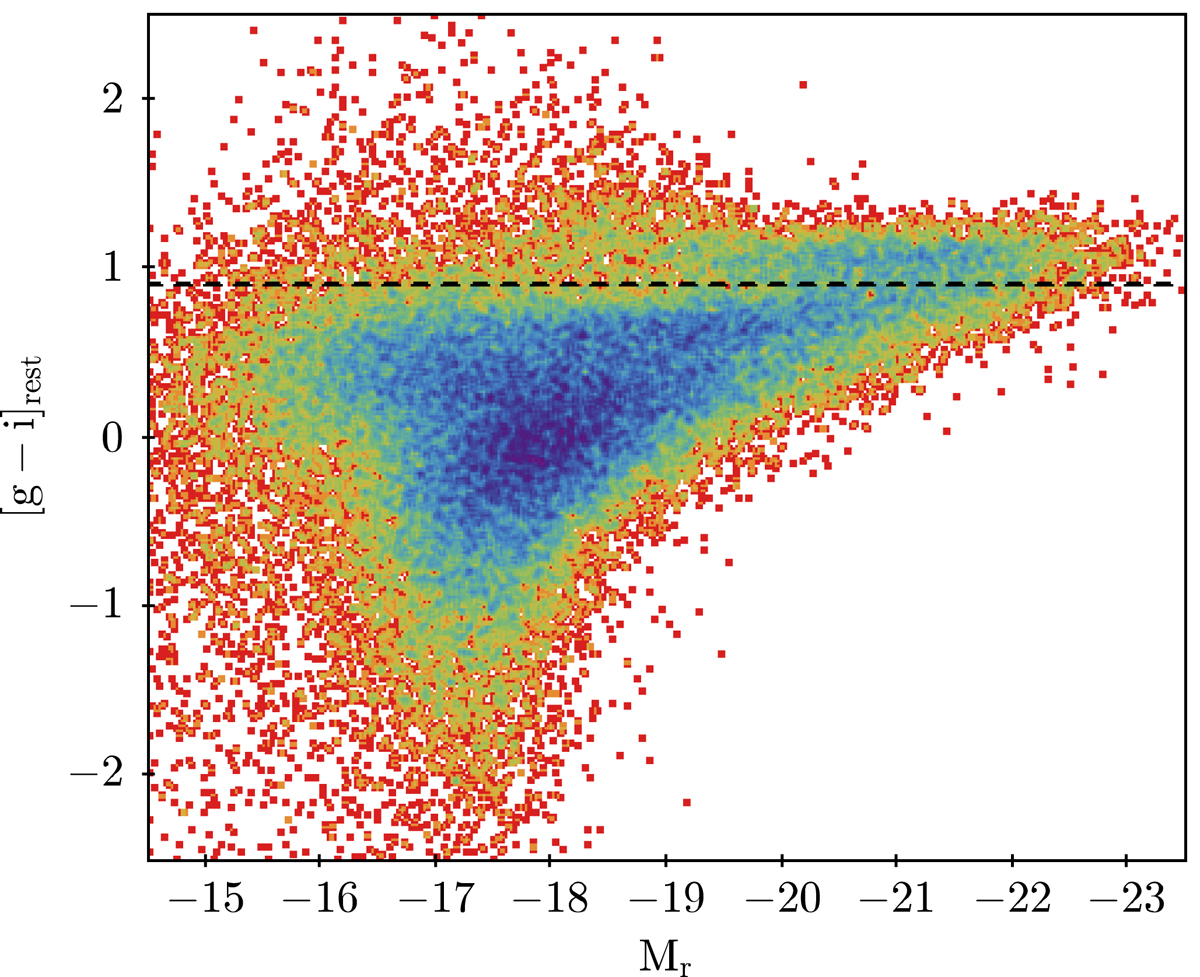
Fig. 3.
Download original image
Distribution of colour [g − i] (rest-frame) vs. r-band absolute magnitude for the FLS. The colour coding of the points (from red to blue) represents increasing galaxy number density. The black dashed line is the criterion of [g − i]rest = 0.9 to separate red and blue galaxies. There are two sequences of galaxies in [g − i]rest > 0.9 and [g − i]rest < 0.9 that are considered as the galaxies of Red Lens and Blue Lens, respectively.
Current usage metrics show cumulative count of Article Views (full-text article views including HTML views, PDF and ePub downloads, according to the available data) and Abstracts Views on Vision4Press platform.
Data correspond to usage on the plateform after 2015. The current usage metrics is available 48-96 hours after online publication and is updated daily on week days.
Initial download of the metrics may take a while.