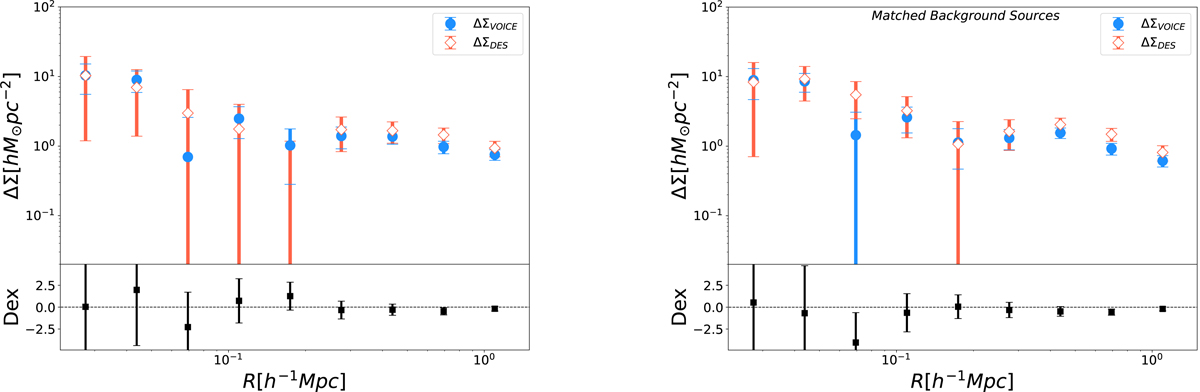
Fig. B.1.
Download original image
Comparison of ESD measurements for VOICE and DES. Left panel plots the ESDs around FLS with the background sources of VOICE and DES-V, and the right panel plots the ESDs around FLS with matched background sources for two surveys. The blue points and orange empty diamonds with error bars indicate the results based on the shape measurements in VOICE and DES surveys, respectively. The black points with error bars (the dex) represent the differences between the measurements from the VOICE relative to the DES.
Current usage metrics show cumulative count of Article Views (full-text article views including HTML views, PDF and ePub downloads, according to the available data) and Abstracts Views on Vision4Press platform.
Data correspond to usage on the plateform after 2015. The current usage metrics is available 48-96 hours after online publication and is updated daily on week days.
Initial download of the metrics may take a while.