Open Access
Fig. A.2.
Download original image
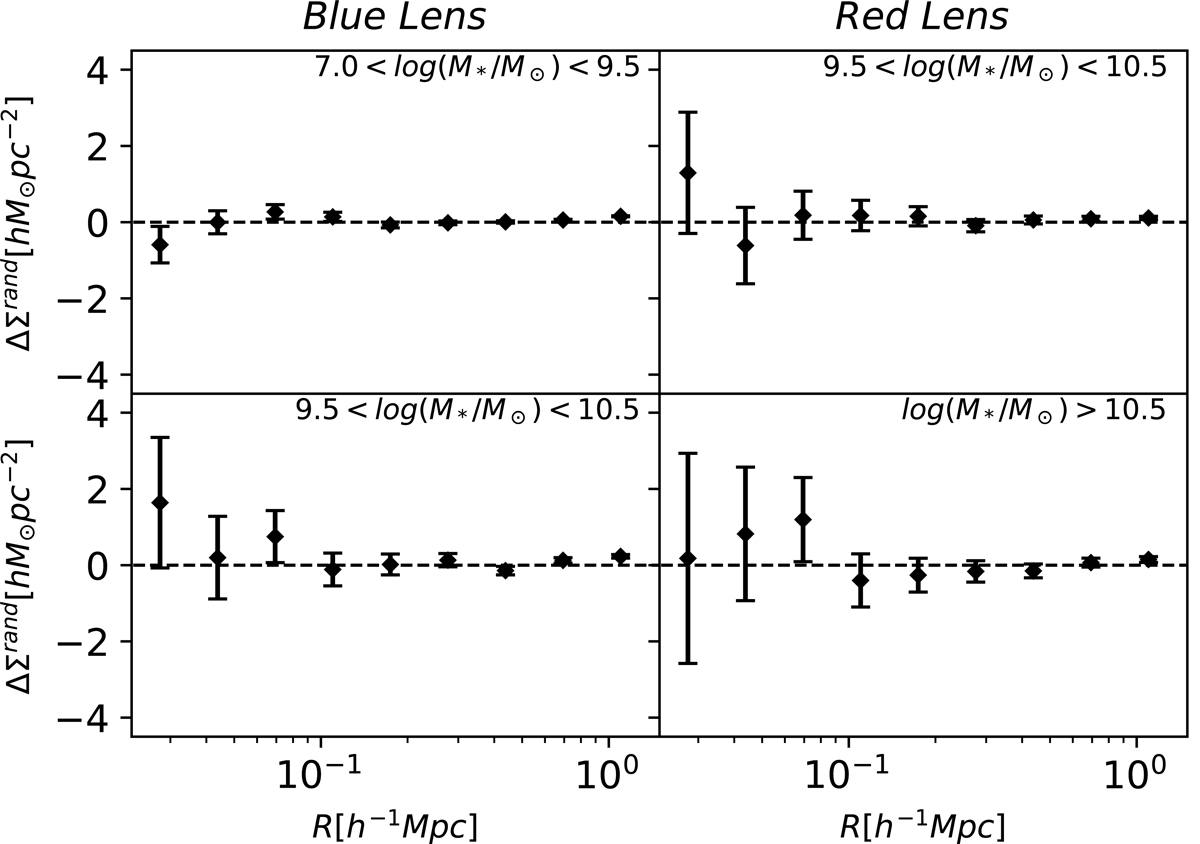
Test for systematic errors in the random-point signals. Top and bottom left panels and top and bottom right panels show the ΔΣrand measured around random points counted 100 times of the galaxies in Blue Lens-1 and -2 and Red-1 and -2 samples, respectively.
Current usage metrics show cumulative count of Article Views (full-text article views including HTML views, PDF and ePub downloads, according to the available data) and Abstracts Views on Vision4Press platform.
Data correspond to usage on the plateform after 2015. The current usage metrics is available 48-96 hours after online publication and is updated daily on week days.
Initial download of the metrics may take a while.