Fig. 12.
Download original image
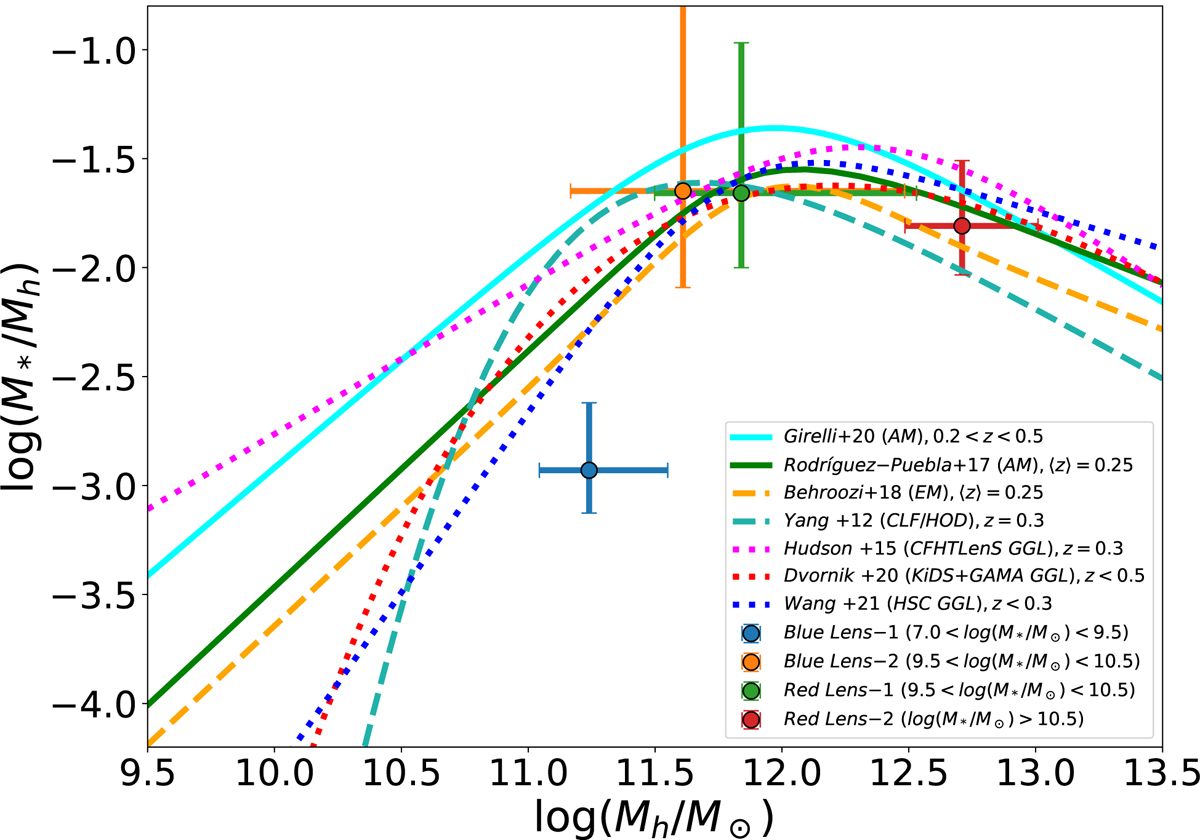
Relation of the fraction of stellar and halo mass vs. halo mass. The circular points with cross error bars are the SHMR results of Blue Lens-1 (blue) and -2 (orange) and Red Lens-1 (green) and -2 (red), respectively. For comparison, here displayed are the SHMR results from different models: AM (the cyan and green solid lines), EM (the orange dashed line), and CLF/HOD(the sea-blue dashed line). Also displayed are galaxy–galaxy lensing results from the surveys of CFHTLenS (the magenta dotted line), KiDS+GAMA (the red dotted line), and HSC (the blue dotted line).
Current usage metrics show cumulative count of Article Views (full-text article views including HTML views, PDF and ePub downloads, according to the available data) and Abstracts Views on Vision4Press platform.
Data correspond to usage on the plateform after 2015. The current usage metrics is available 48-96 hours after online publication and is updated daily on week days.
Initial download of the metrics may take a while.