Fig. 11.
Download original image
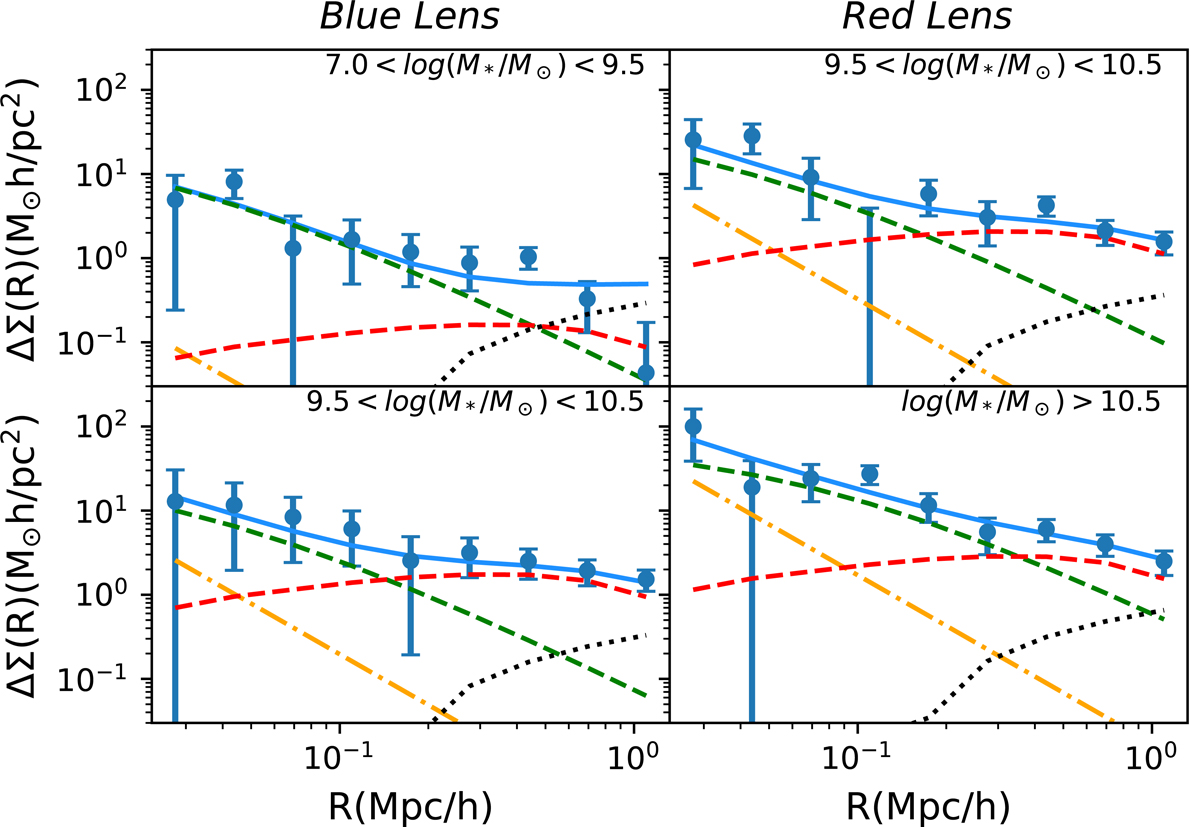
Model fitting curves from MCMC procedure for the ΔΣ signals measured around Blue Lens-1 (top left panel), Blue Lens-2 (bottom left panel), Red Lens-1 (top right panel), and Red Lens-2 (bottom right panel). The best-fitting curve (blue solid line) is comprised of the contribution from different components that are stellar term (orange dash-dotted line), central term (green dashed line), satellite term (red dashed line), and two-halo term (black dotted line), respectively.
Current usage metrics show cumulative count of Article Views (full-text article views including HTML views, PDF and ePub downloads, according to the available data) and Abstracts Views on Vision4Press platform.
Data correspond to usage on the plateform after 2015. The current usage metrics is available 48-96 hours after online publication and is updated daily on week days.
Initial download of the metrics may take a while.