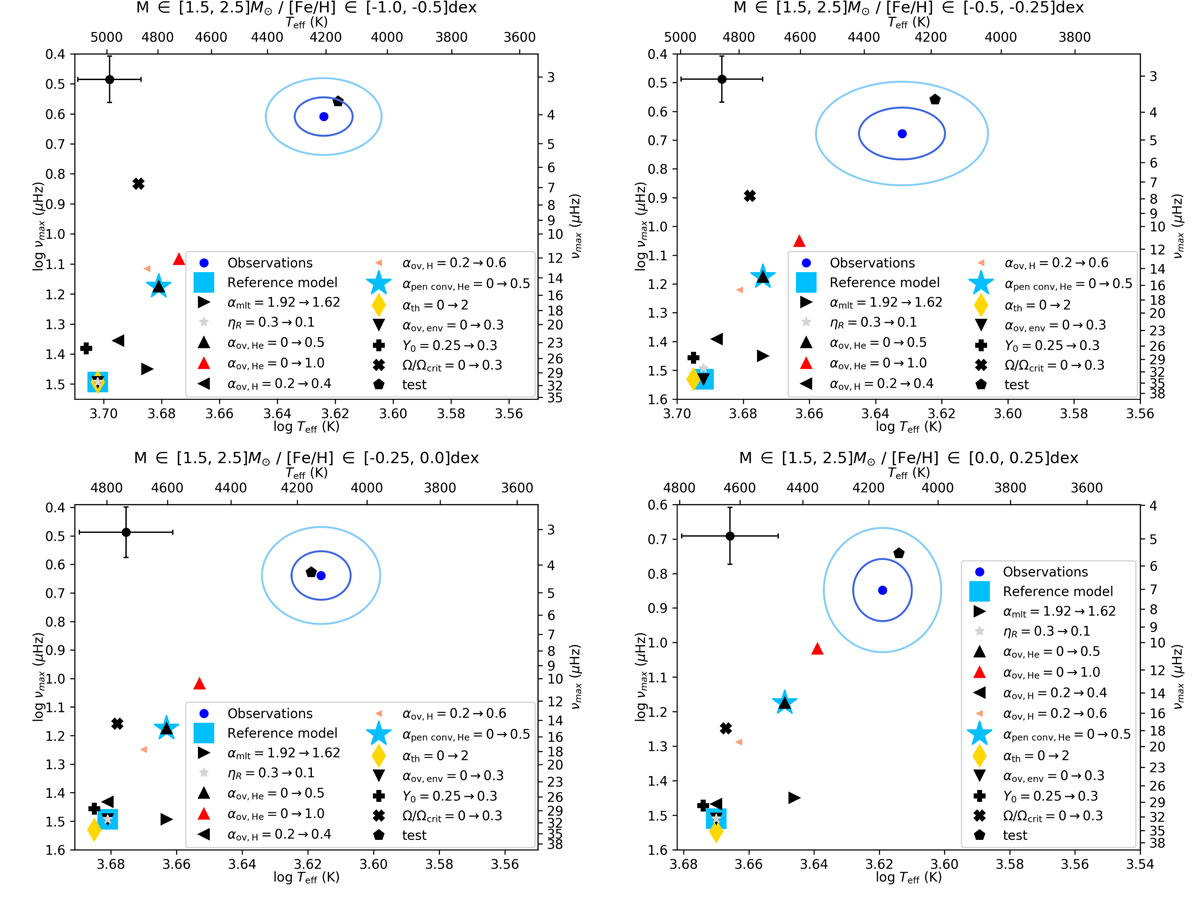
Fig. 7.
Download original image
Location of the AGBb in the plane log Teff; log νmax, in the mass bin, M ∈ [1.5, 2.5] M⊙, and metallicity bins, [Fe/H] ∈ [ − 1.0, −0.5], [ − 0.5, −0.25], [ − 0.25, 0.0], [0.0, 0.25] dex. The label is the same as in Fig. 5. An additional model represented by a black cross was computed to explore the effects of rotation by taking the rotation rate ΩZAMS/Ωcrit = 0.3 during the main sequence, relative to the reference model, where Ωcrit is the surface critical angular velocity for the star to be dislocated. Another model, labelled ‘test’ and represented by a black pentagon, was also computed to check if combining several changes could allow us to reproduce the observations. With respect to the reference model, these changes are the adding of rotation ΩZAMS/Ωcrit = 0.3, He-core overshooting αov, He = 1.0, the removal of H-core overshooting αov, H = 0.2 → 0, and the decrease of αMLT = 1.92 → 1.62. The numerical values are listed in Table A.4. We caution that the range of the axes are not the same between panels.
Current usage metrics show cumulative count of Article Views (full-text article views including HTML views, PDF and ePub downloads, according to the available data) and Abstracts Views on Vision4Press platform.
Data correspond to usage on the plateform after 2015. The current usage metrics is available 48-96 hours after online publication and is updated daily on week days.
Initial download of the metrics may take a while.