Fig. 4.
Download original image
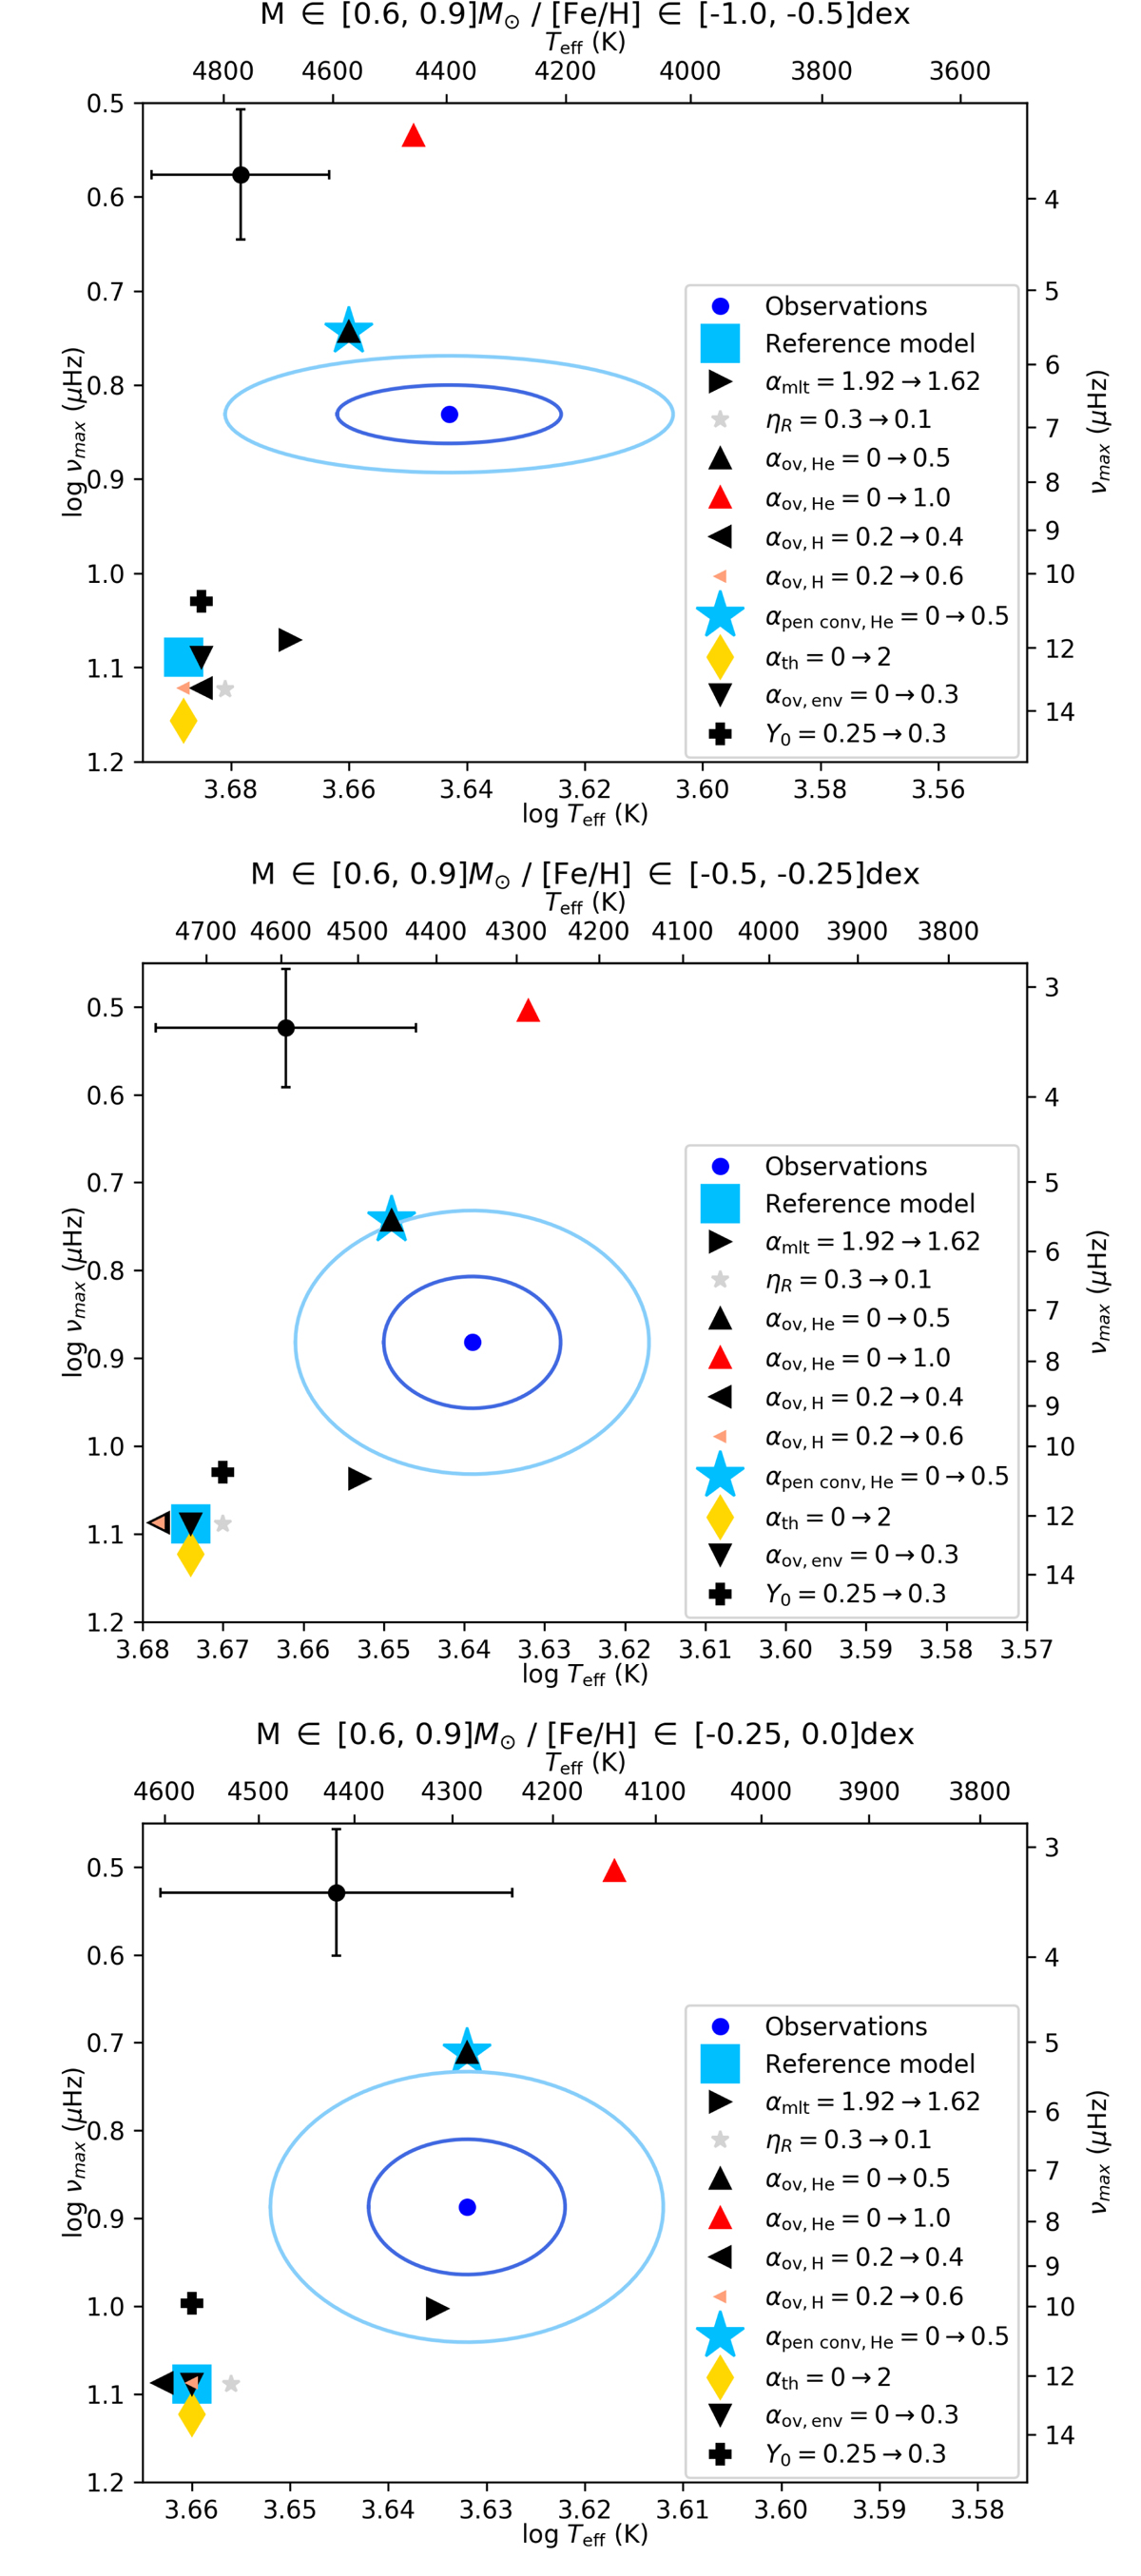
Location of the AGBb in the plane log Teff; log νmax, in the mass bin, M ∈ [0.6, 0.9] M⊙, and metallicity bins, [Fe/H] ∈ [ − 1.0, −0.5], [ − 0.5, −0.25], [ − 0.25, 0.0] dex. The metallicity bin [Fe/H] ∈ [0.0, 0.25] dex is missing because we do not have enough stars to perform a statistically sound study. Observations are marked by blue dots, while the dark blue and light blue ellipses correspond to the 1σ and 2σ regions, respectively. The reference model presented is shown by a light blue square. Other models are shown with different symbols listed in the labels; they have been obtained by individually changing the parameters of the reference model. The changes are indicated in the label of each panel. The black dot with errorbars indicates the mean uncertainty we have for all models. The uncertainty on the AGBb location in log νmax and log Teff for each model is taken as the standard deviation of the Gaussian function that reproduces the overdensity caused by the AGBb in the 1D histograms. The numerical values are listed in Table A.1. Ranges of the axes vary in the different panels.
Current usage metrics show cumulative count of Article Views (full-text article views including HTML views, PDF and ePub downloads, according to the available data) and Abstracts Views on Vision4Press platform.
Data correspond to usage on the plateform after 2015. The current usage metrics is available 48-96 hours after online publication and is updated daily on week days.
Initial download of the metrics may take a while.