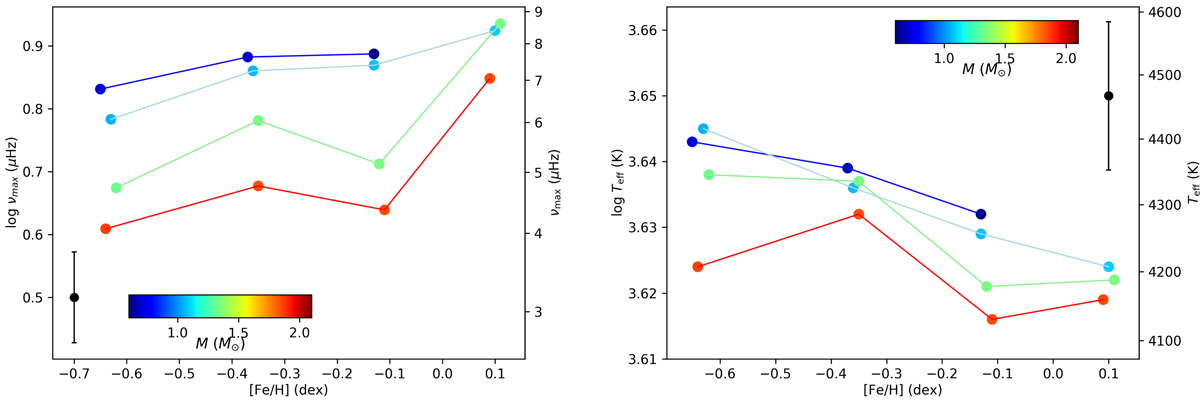
Fig. 3.
Download original image
Location of the AGBb in log νmax (left) and in log Teff (right) from observations, as a function of the metallicity, [Fe/H]. The AGBb occurrence is marked by dots and the stellar mass is colour-coded. AGBb locations obtained in the same bin of mass, M ∈ [0.6, 0.9], [0.9, 1.2], [1.2, 1.5], [1.5, 2.5] M⊙ are connected by dark blue, light blue, light green, and red lines, respectively. Mean error bars on the location of the AGBb in log νmax and in log Teff are shown in black. Data in the bin M ∈ [0.6, 0.9] M⊙; [Fe/H] ∈ [0, 0.25] dex are not shown because there are not enough stars to perform the statistical mixture model.
Current usage metrics show cumulative count of Article Views (full-text article views including HTML views, PDF and ePub downloads, according to the available data) and Abstracts Views on Vision4Press platform.
Data correspond to usage on the plateform after 2015. The current usage metrics is available 48-96 hours after online publication and is updated daily on week days.
Initial download of the metrics may take a while.