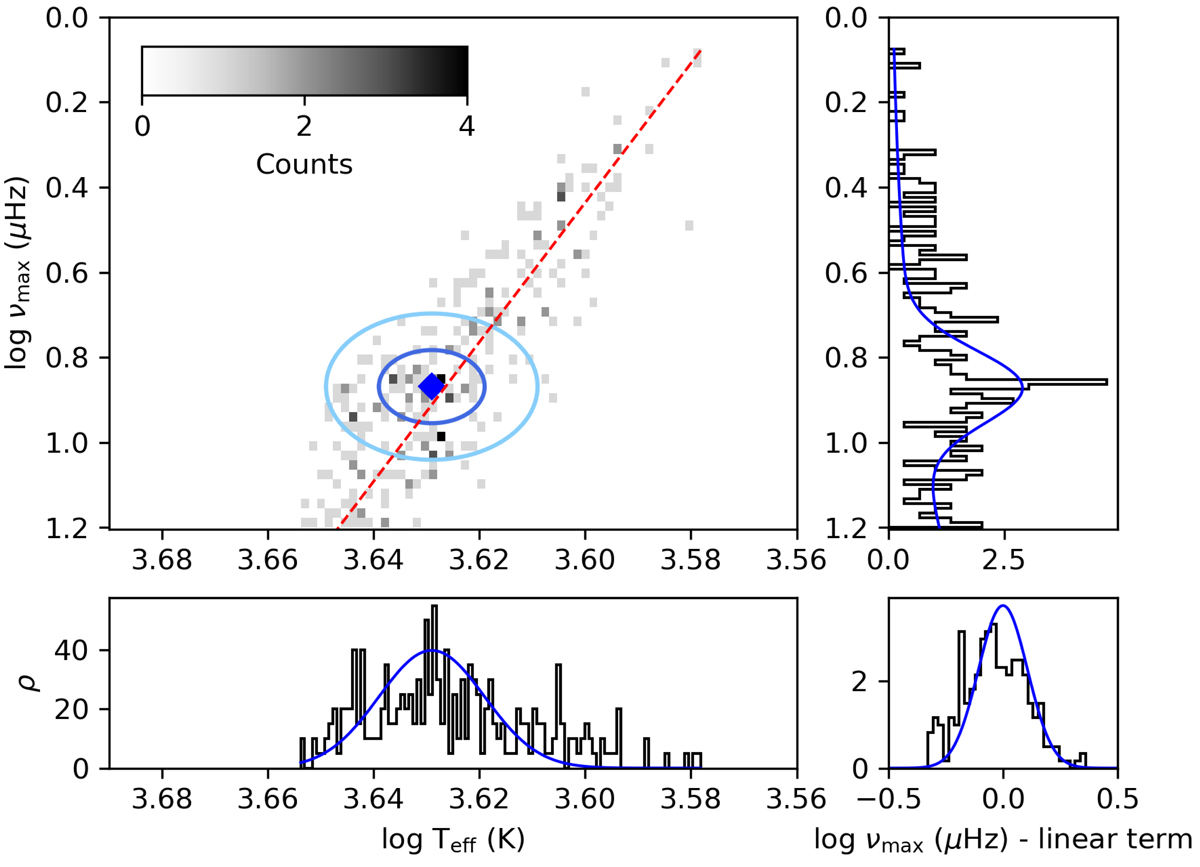
Fig. 2.
Download original image
Probability distribution functions of our data set in the log Teff; log νmax plane, in the bins M ∈ [0.9, 1.2] M⊙ and [Fe/H] ∈ [ − 0.25, 0.0] dex. Upper left panel: 2D histogram where the AGBb is located by a blue diamond. Dark blue and light blue ellipses correspond to the 1σ and 2σ regions of the bivariate Gaussian, respectively. The red dashed line reproduces the linear term belonging to the RGB/AGB background. Upper right panel: normalised 1D histogram in log νmax is shown in black. The ordinate axis is the same as in the upper left panel. The blue line corresponds to the probability distribution function made of the Gaussian associated to the overdensity in log νmax, multiplied by the rising exponential in log νmax. Lower left panel: same label as in the upper right panel but in terms of log Teff. The abscissa axis is the same as in the upper left panel. The blue line shows the Gaussian associated to the overdensity in log Teff. Lower right panel: difference between log νmax and abglog Teff + bbg. The blue line illustrates the normal distribution around the linear term.
Current usage metrics show cumulative count of Article Views (full-text article views including HTML views, PDF and ePub downloads, according to the available data) and Abstracts Views on Vision4Press platform.
Data correspond to usage on the plateform after 2015. The current usage metrics is available 48-96 hours after online publication and is updated daily on week days.
Initial download of the metrics may take a while.