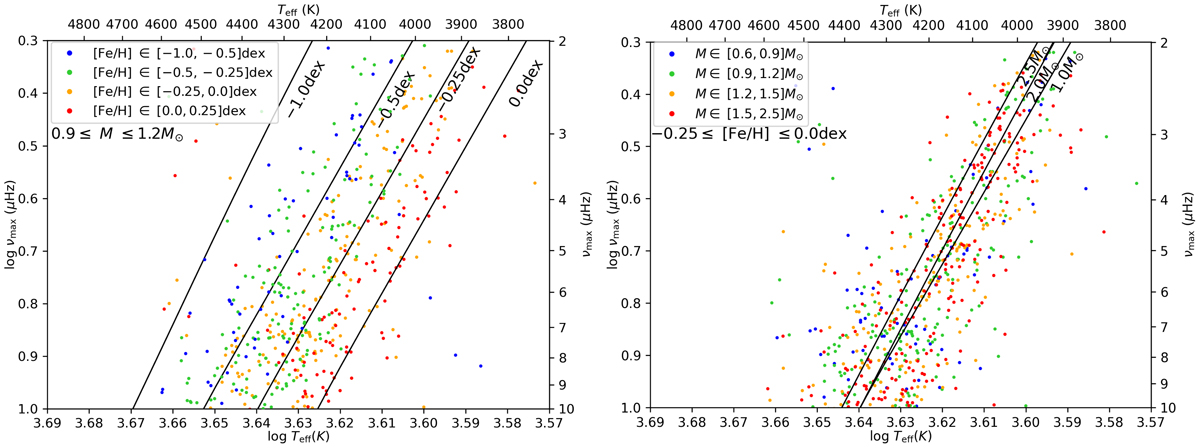
Fig. 1.
Download original image
Seismic HR diagram of our sample of stars in the bin of mass, M ∈ [0.9, 1.2] M⊙ (left) and in the bin of metallicity, [Fe/H] ∈ [ − 0.25, 0.0] dex (right). In both panels, stars with different metallicities (left) and masses (right) are represented with different colours. On top of those observations, stellar evolutionary tracks along the AGB are represented with black lines at different metallicities at 1 M⊙ (left) and masses at [Fe/H] = −0.25 dex (right).
Current usage metrics show cumulative count of Article Views (full-text article views including HTML views, PDF and ePub downloads, according to the available data) and Abstracts Views on Vision4Press platform.
Data correspond to usage on the plateform after 2015. The current usage metrics is available 48-96 hours after online publication and is updated daily on week days.
Initial download of the metrics may take a while.