Fig. 6.
Download original image
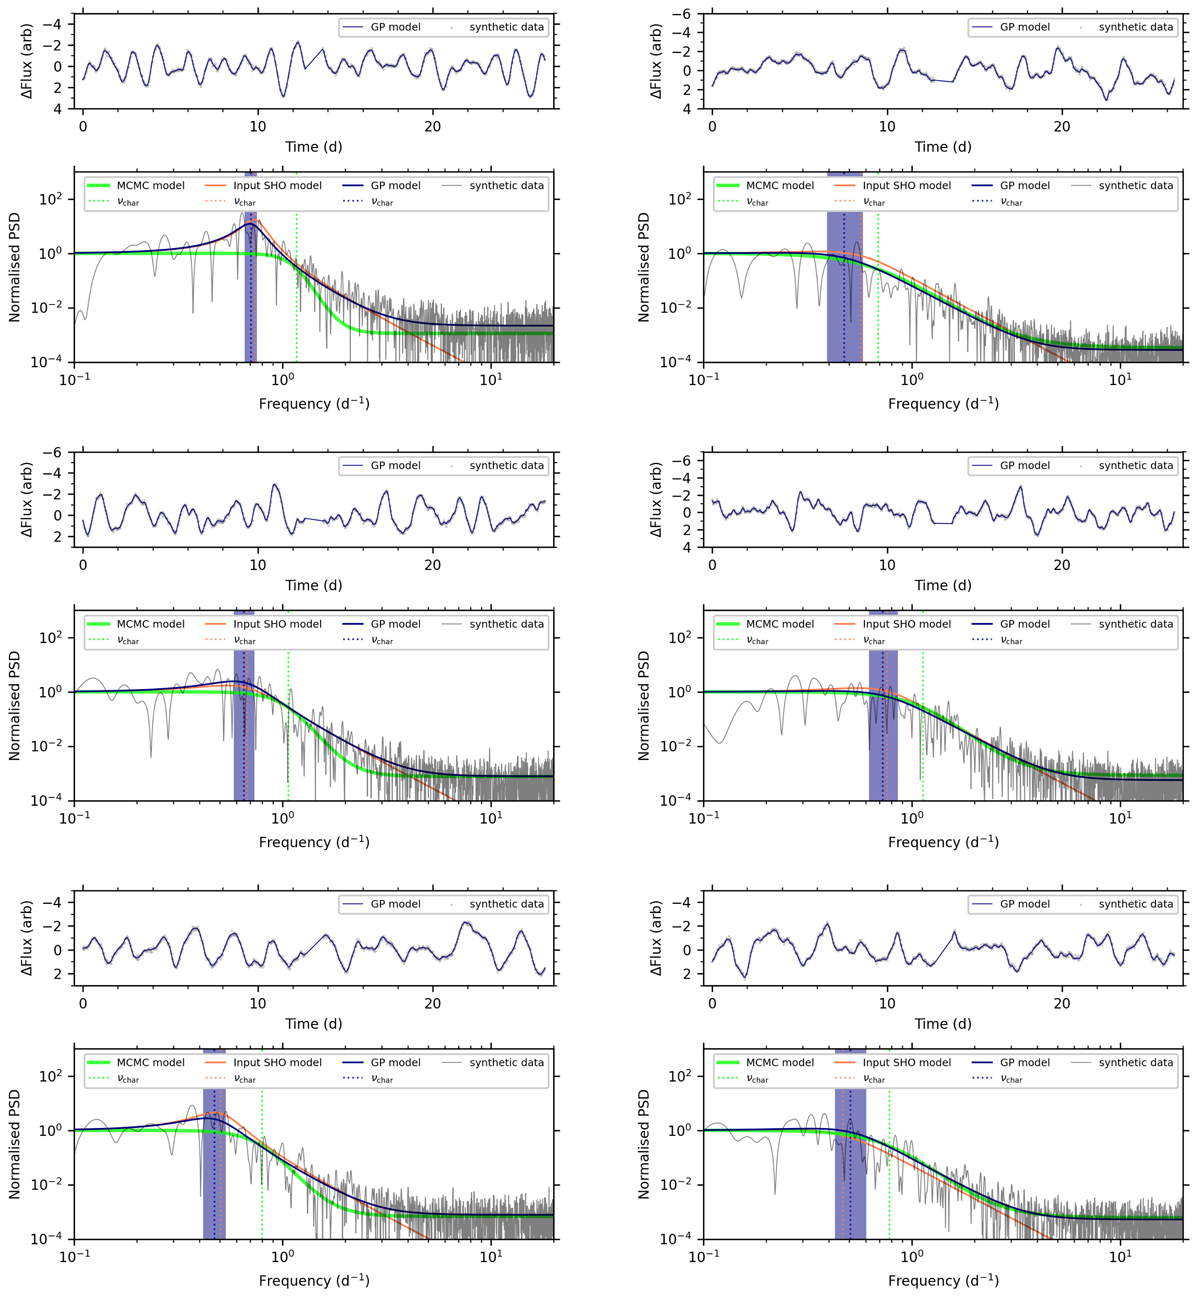
Examples of results of GP regression and amplitude spectrum fitting for synthetic light curves. The left and right columns show three examples that resemble yellow and blue subgroup members in terms of their quality factor, respectively. The blue and green shaded regions denote the 94% confidence interval for νchar for each method. In all cases, the true input value of νchar is recovered well by the GP model with CELERITE2, whereas the MCMC method of Bowman et al. (2020) sometimes overestimates the value of νchar because of the more rigid profile imposed in the Fourier domain, as demonstrated by a comparison with the noiseless input SHO model.
Current usage metrics show cumulative count of Article Views (full-text article views including HTML views, PDF and ePub downloads, according to the available data) and Abstracts Views on Vision4Press platform.
Data correspond to usage on the plateform after 2015. The current usage metrics is available 48-96 hours after online publication and is updated daily on week days.
Initial download of the metrics may take a while.