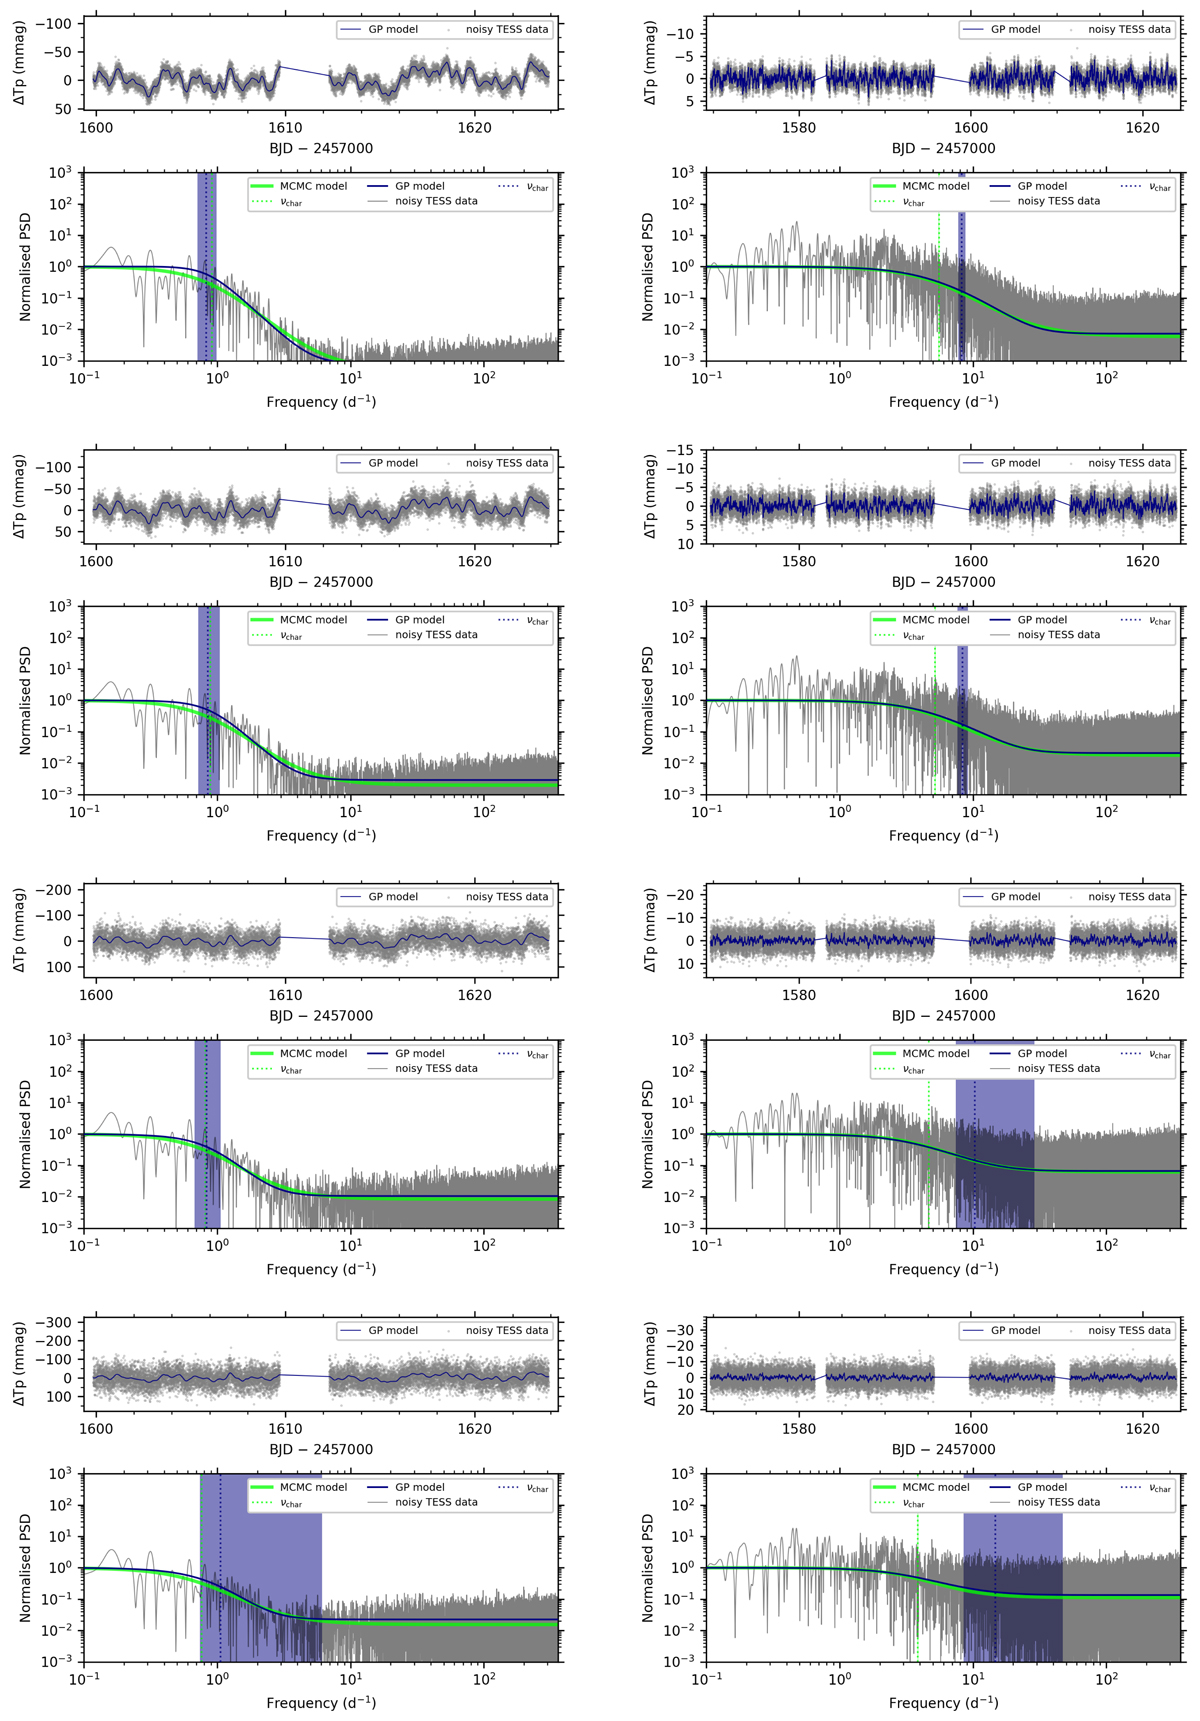
Fig. 5.
Download original image
Results of GP regression and amplitude spectrum fitting for the noise-enhanced light curves of HD 112244 (TIC 406050497) and HD 96715 (TIC 306491594), which are typical yellow and blue subgroup members, are shown in the left and right columns, respectively. From top to bottom, increasingly larger amounts of white noise has been added. The blue and green shaded regions denote the 94% confidence interval for νchar for each method. The νchar values from the GP regression are more consistent, on average, than those from fitting the amplitude spectrum.
Current usage metrics show cumulative count of Article Views (full-text article views including HTML views, PDF and ePub downloads, according to the available data) and Abstracts Views on Vision4Press platform.
Data correspond to usage on the plateform after 2015. The current usage metrics is available 48-96 hours after online publication and is updated daily on week days.
Initial download of the metrics may take a while.