Open Access
Fig. 4.
Download original image
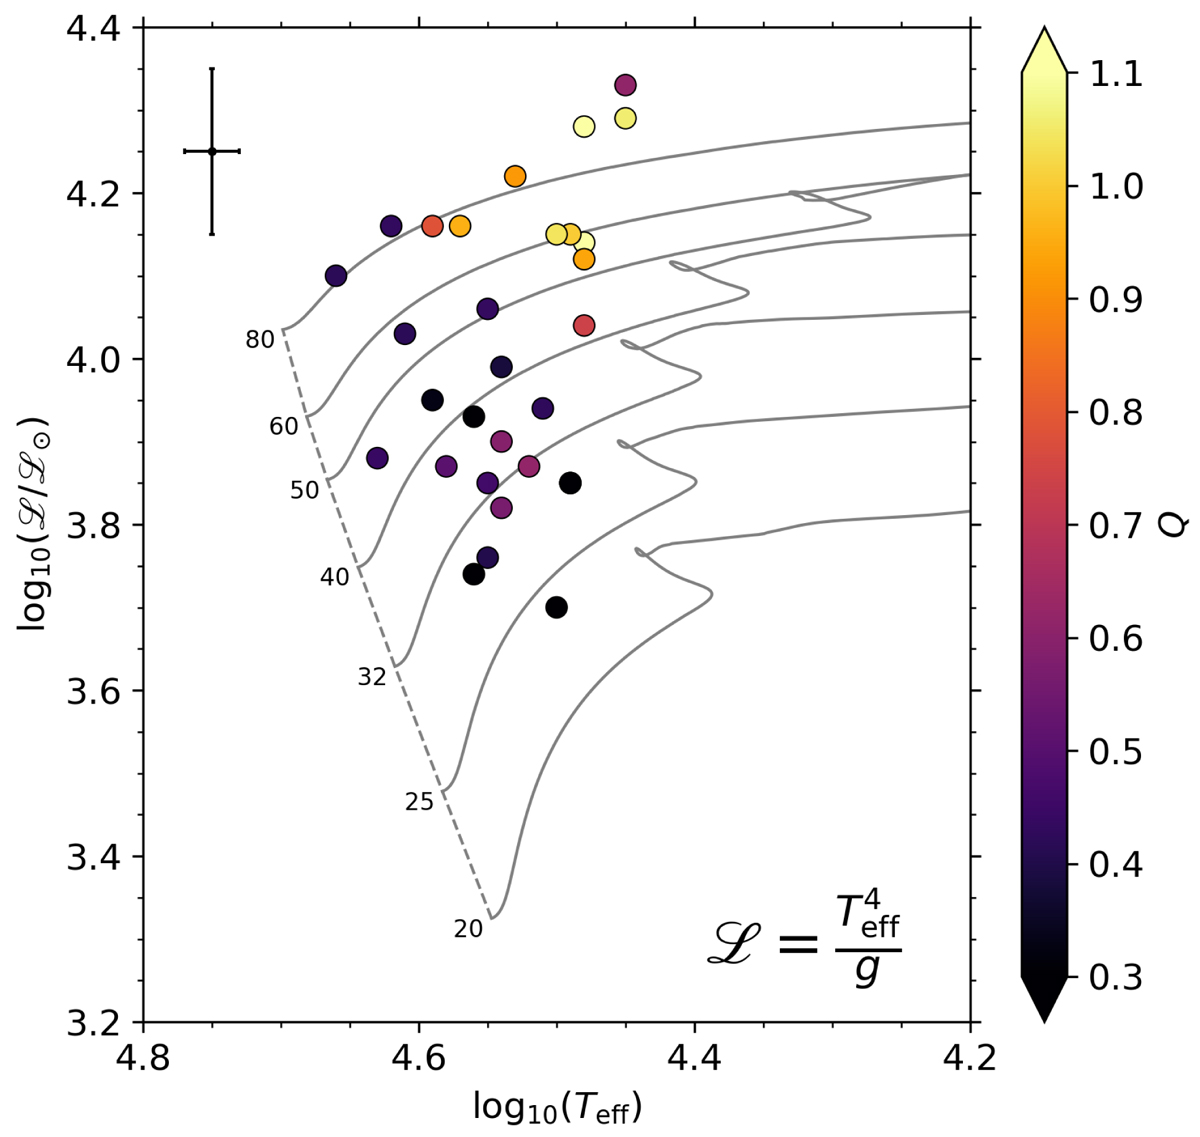
Spectroscopic HR diagram of the same O stars as in Fig. 3 but colour-coded by the quality factor, Q, of the variability as determined in our GP regression.
Current usage metrics show cumulative count of Article Views (full-text article views including HTML views, PDF and ePub downloads, according to the available data) and Abstracts Views on Vision4Press platform.
Data correspond to usage on the plateform after 2015. The current usage metrics is available 48-96 hours after online publication and is updated daily on week days.
Initial download of the metrics may take a while.